
Page 68 - JCTR-10-1
P. 68
64 Zhuang et al. | Journal of Clinical and Translational Research 2024; 10(1): 62-71
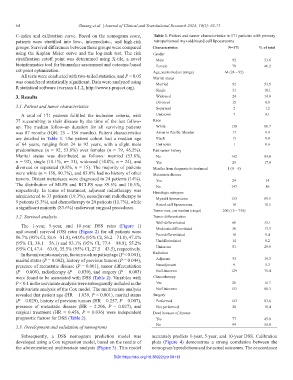
C-index and calibration curve. Based on the nomogram score, Table 1. Patient and tumor characteristics in 171 patients with primary
patients were stratified into low-, intermediate-, and high-risk retroperitoneal myxoid/round cell liposarcoma
groups. Survival differences between these groups were compared Characteristics N=171 % of total
using the Kaplan–Meier curve and the log-rank test. The risk Gender
stratification cutoff point was determined using X-tile, a novel Male 92 53.8
bioinformatics tool for biomarker assessment and outcome-based Female 79 46.2
cut-point optimization. Age, years median (range) 64 (24 – 92)
All tests were conducted with two-tailed statistics, and P < 0.05 Marital status
was considered statistically significant. Data were analyzed using Married 92 53.8
R statistical software (version 4.1.2, http://www.r-project.org). Single 31 18.1
3. Results Widowed 24 14.0
Divorced 15 8.8
3.1. Patient and tumor characteristics Separated 2 1.2
A total of 171 patients fulfilled the inclusion criteria, with Unknown 7 4.1
77 succumbing to their disease by the time of the last follow- Race
up. The median follow-up duration for all surviving patients White 138 80.7
was 87 months (IQR: 25 – 156 months). Patient characteristics Asian or Pacific Islander 17 9.9
are detailed in Table 1. The patient cohort had a median age Black 15 8.8
of 64 years, ranging from 24 to 92 years, with a slight male Unknown 1 0.6
predominance (n = 92, 53.8%) over females (n = 79, 46.2%). Past tumor history
Marital status was distributed as follows: married (53.8%, No 142 83.0
n = 92), single (18.1%, n= 31), widowed (14.0%, n = 24), and Yes 29 17.0
divorced or separated (8.8%, n = 15). The majority of patients Months from diagnosis to treatment 1 (0 – 6)
were white (n = 138, 80.7%), and 83.0% had no history of other Metastasis disease
tumors. Distant metastases were diagnosed in 24 patients (14%). Yes 24 14
The distribution of MLPS and RCLPS was 89.5% and 10.5%, No 147 86
respectively. In terms of treatment, adjuvant radiotherapy was Histologic subtypes
administered to 33 patients (19.3%), neoadjuvant radiotherapy to Myxoid liposarcoma 153 89.5
9 patients (5.3%), and chemotherapy to 20 patients (11.7%), while Round cell liposarcoma 18 10.5
a significant majority (83.6%) underwent surgical procedures.
Tumor size, cm median (range) 200 (15 – 750)
3.2. Survival analysis Tumor differentiation
Well-differentiated 60 35.1
The 1-year, 5-year, and 10-year DSS rates (Figure 1)
and overall survival (OS) rates (Figure 2) for all patients were Moderate-differentiated 30 17.5
Poor-differentiated
9.4
16
86.7% (95% CI, 81.6 – 81.8), 64.0% (95% CI, 56.2 – 71.8), 47.1%
(95% CI, 38.1 – 56.1) and 83.1% (95% CI, 77.4 – 88.8), 55.2% Undifferentiated 14 8.2
(95% CI, 47.4 – 63.0), 35.5% (95% CI, 27.5 – 43.5), respectively. Unknown 51 29.8
In the univariate analysis, factors such as patient age (P < 0.001), Radiation
marital status (P = 0.002), history of previous tumors (P = 0.044), Adjuvant 33 19.3
presence of metastatic disease (P = 0.001), tumor differentiation Neoadjuvant 9 5.3
(P = 0.009), radiotherapy (P = 0.030), and surgery (P = 0.003) No/Unknown 129 75.4
were found to be associated with DSS (Table 2). Variables with Chemotherapy
P < 0.1 in the univariate analysis were subsequently included in the Yes 20 11.7
multivariate analysis of the Cox model. The multivariate analysis No/Unknown 151 88.3
revealed that patient age (HR = 1.039, P < 0.001), marital status Surgery
(P = 0.029), history of previous tumors (HR = 0.257, P = 0.007), Performed 143 83.6
presence of metastatic disease (HR = 2.206, P = 0.027), and Not performed 28 16.4
surgical treatment (HR = 0.456, P = 0.036) were independent Dead because of disease
prognostic factors for DSS (Table 2). Yes 77 45.0
No 94 55.0
3.3. Development and validation of nomograms
Subsequently, a DSS nomogram prediction model was accurately predicts 1-year, 5-year, and 10-year DSS. Calibration
developed using a Cox regression model, based on the results of plots (Figure 4) demonstrate a strong correlation between the
the aforementioned multivariate analysis (Figure 3). This model nomogram’s predictions and the actual outcomes. The concordance
DOI: https://doi.org/10.36922/jctr.00113