
Page 69 - JCTR-10-1
P. 69
Zhuang et al. | Journal of Clinical and Translational Research 2024; 10(1): 62-71 65
Table 2. Univariable and multivariable analyses to determine independent predictors of disease-specific survival in primary retroperitoneal
myxoid/round cell liposarcoma
Variables Univariate analysis Multivariate analysis
Hazard ratio (95% CI) P‑value Hazard ratio (95% CI) P‑value
Gender female versus male 0.950 (0.607 – 1.487) 0.823
Age (continuous) 1.033 (1.015 – 1.051) <0.001 1.039 (1.017 – 1.061) <0.001
Marital status 0.002 0.029
Single vs. married 0.448 (0.209 – 0.960) 0.408 (0.181 – 0.921)
Widowed vs. married 1.288 (0.701 – 2.369) 0.722 (0.363 – 1.436)
Divorced vs. married 2.053 (1.018 – 4.143) 1.916 (0.931 – 3.940)
Separated vs. married 4.972 (1.184 – 20.887) 4.701 (0.818 – 27.029)
Unknown vs. married 3.792 (1.132 – 12.699) 0.734 (0.155 – 3.483)
Race 1.000
Asian Pacific Islander vs. White 0.971 (0.465 – 2.030)
Black vs. White 0.982 (0.449 – 2.148)
Unknown vs. White NA
Past tumor history yes vs. no 0.628 (0.399 – 0.988) 0.044 0.257 (0.096 – 0.688) 0.007
Months from diagnosis to treatment (continuous) 0.907 (0.707 – 1.163) 0.907
Metastatic disease yes vs. no 2.666 (1.510 – 4.707) 0.001 2.206 (1.096 – 4.438) 0.027
Histologic subtypes round cell vs. myxoid 1.759 (0.902 – 3.433) 0.098 1.936 (0.776 – 4.825) 0.156
Tumor size (continuous) 1.001 (1.000 – 1.003) 0.120
Tumor differentiation 0.009 0.471
Moderate vs. well 0.961 (0.513 – 1.801) 0.961 (0.478 – 1.929)
Poor vs. well 3.123 (1.545 – 6.315) 1.993 (0.754 – 5.273)
Undifferentiated vs. well 0.585 (0.205 – 1.671) 0631 (0.178 – 2.233)
Unknown vs. well 1.220 (0.680 – 2.189) 0.939 (0.498 – 1.771)
Radiotherapy yes vs. no 0.030 0.170
Adjuvant vs. no/unknown 0.432 (0.227 – 0.823) 0.567 (0.262 – 1.228)
Neoadjuvant vs. no/unknown 0.539 (.0132 – 2.204) 0.385 (0.086 – 1.722)
Chemotherapy yes vs. no/unknown 1.695 (0.867 – 3.314) 0.123
Surgery performed vs. not performed 0.423 (0.240 – 0.747) 0.003 0.490 (0.251 – 0.954) 0.036
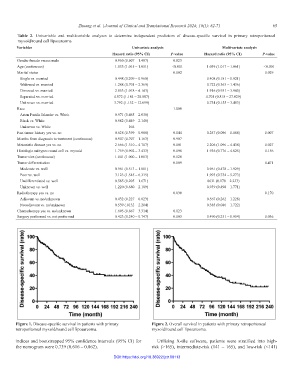
Figure 1. Disease-specific survival in patients with primary Figure 2. Overall survival in patients with primary retroperitoneal
retroperitoneal myxoid/round cell liposarcoma. myxoid/round cell liposarcoma.
indices and bootstrapped 95% confidence intervals (95% CI) for Utilizing X-tile software, patients were stratified into high-
the nomogram were 0.739 (0.616 – 0.862). risk (>165), intermediate-risk (141 – 165), and low-risk (<141)
DOI: https://doi.org/10.36922/jctr.00113