
Page 10 - JCTR-10-3
P. 10
184 Xie et al. | Journal of Clinical and Translational Research 2024; 10(3): 180-190
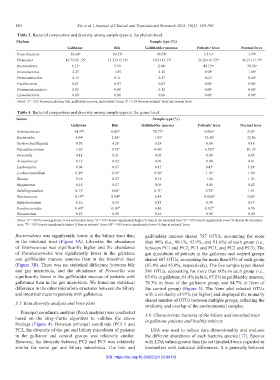
Table 3. Bacterial composition and diversity among sample types at the phylum level.
Phylum Sample type (%)
Gallstone Bile Gallbladder mucosa Patients’ feces Normal feces
Proteobacteria 83.68 y 89.53 y 90.78 y 6.51x y 3.74 x
Firmicutes 16.75±21.55 y 13.33±15.56 y 9.85±13.37 y 36.20±16.52 xy 44.21±11.79 x
Bacteroidetes 6.11 y 3.76 y 2.04 y 44.13 xy 50.56 x
Actinobacteria 2.27 1.85 2.12 0.98 x 1.10 x
Verrucomicrobia 0.15 0.11 0.17 0.01 x 0.00 x
Fusobacteria 0.01 0.03 0.02 0.00 x 0.00 x
Gemmatimonadetes 0.05 0.00 0.12 0.00 x 0.00 x
Cyanobacteria 0.00 0.00 0.00 0.00 x 0.00 x
Notes: P > 0.05 between gallstone, bile, gallbladder mucosa, and patients’ feces; P < 0.05 between patients’ feces and normal feces
x
y
Table 4. Bacterial composition and diversity among sample types at the genus level.
Genus Sample type (%)
Gallstone Bile Gallbladder mucosa Patients’ feces Normal feces
Achromobacter 34.97 m 0.00 m 78.77 m 0.00z m 0.29 z
Bacteroides 4.84 n 2.58 n 1.43 n 32.40 n 32.86
Escherichia/Shigella 0.76 0.28 0.24 0.86 0.18
Faecalibacterium 1.26 n 0.72 n 0.46 n 6.52z n 10.15 z
Prevotella 0.11 0.21 0.08 0.84 0.45
Acinetobacter 0.12 0.12 0.09 0.00 0.01
Lachnospira 0.08 0.17 0.15 0.43 z 3.24 z
Lachnoclostridium 0.20 n 0.16 n 0.08 n 1.10 n 1.80
Blautia 0.16 0.27 0.14 1.62 1.03
Megamonas 0.14 0.07 0.09 0.05 0.02
Subdoligranulum 0.13 n 0.08 n 0.11 n 0.74 n 1.61
Enterococcus 0.19 M 0.04 M 0.14 0.02z M 0.00 z
Bifidobacterium 0.16 0.28 0.13 0.30 0.57
Parabacteroides 0.40 N 0.10 N 0.10 0.82 N 0.76
Eubacterium 0.25 0.48 0.24 0.80 0.40
Notes: P < 0.05 between patients’ feces and normal feces; P < 0.05 denote significantly higher % than in the intestinal tract; P < 0.05 denote significantly lower % than in the intestinal
z
m
n
tract; P < 0.05 denote significantly higher % than in patients’ feces; NP < 0.05 denote significantly lower % than in patients’ feces
M
Bacteroidetes was significantly lower in the biliary tract than gallbladder mucosa shared 757 OTUs, accounting for more
in the intestinal tract (Figure 3A). Likewise, the abundance than 90% (i.e., 90.1%, 93.9%, and 91.6%) of each group (i.e.,
of Enterococcus was significantly higher and the abundance between PC1 and PC2; PC1 and PC3; and PC2 and PC3). The
of Parabacteroides was significantly lower in the gallstone gut microbiota of patients in the gallstone and control groups
and gallbladder mucosa samples than in the intestinal tract shared 607 OTUs, accounting for more than 85% of each group
(Figure 3B). There was no statistical difference between bile (87.8% and 95.0%, respectively). The five sample types shared
and gut microbiota, and the abundance of Prevotella was 541 OTUs, accounting for more than 60% in each group (i.e.,
significantly lower in the gallbladder mucosa of patients with 65.6% in gallstone, 64.4% in bile, 67.1% in gallbladder mucosa,
gallstones than in the gut microbiota. We found no statistical 78.3% in feces of the gallstone group, and 84.7% in feces of
difference in the other microflora structures between the biliary the control group) (Figure 5). The Venn plot selected OTUs
and intestinal tracts in patients with gallstones. with a similarity of 97% (or higher) and displayed the mutually
shared number of OTUs between multiple groups, reflecting the
3.5. Beta diversity analysis and Venn plots
similarity and overlap of the environmental samples.
Principal coordinate analysis (PcoA analysis) was conducted 3.6. Characteristic bacteria of the biliary and intestinal tract
based on the Bray-Curtis algorithm to validate the above in gallstone patients and healthy subjects
findings (Figure 4). Between principal coordinate (PC) 1 and
PC2, the diversity of the gut and biliary microbiota of patients LDA was used to reduce data dimensionality and evaluate
in the gallstone and control groups was relatively similar. the different abundance of each bacteria species [17]. Species
However, the diversity between PC2 and PC3 was relatively with LDA values greater than the set threshold were regarded as
similar for some gut and biliary microbiota. The bile and biomarkers with statistical differences. It is generally believed
DOI: https://doi.org/10.36922/jctr.23.00118