
Page 13 - JCTR-10-3
P. 13
Xie et al. | Journal of Clinical and Translational Research 2024; 10(3): 180-190 187
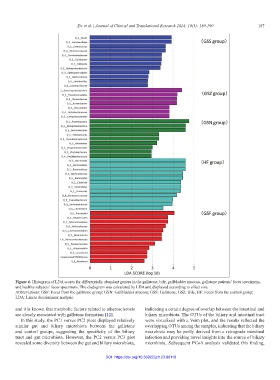
Figure 6. Histogram of LDA scores for differentially abundant genera in the gallstone, bile, gallbladder mucosa, gallstone patients’ feces specimens,
and healthy subjects’ feces specimens. The cladogram was calculated by LDA and displayed according to effect size.
Abbreviations: GSF: Feces from the gallstone group; GSN: Gallbladder mucosa; GSS: Gallstone; GSZ: Bile; HF: Feces from the control group;
LDA: Linear discriminant analysis.
and it is known that metabolic factors related to atherosclerosis indicating a certain degree of overlap between the intestinal and
are closely associated with gallstone formation [12]. biliary microbiota. The OTUs of the biliary and intestinal tract
In this study, the PC1 versus PC2 plots displayed relatively were visualized with a Venn plot, and the results reflected the
similar gut and biliary microbiota between the gallstone overlapping OTUs among the samples, indicating that the biliary
and control groups, suggesting the specificity of the biliary microbiota may be partly derived from a retrograde intestinal
tract and gut microbiota. However, the PC2 versus PC3 plot infection and providing novel insights into the source of biliary
revealed some diversity between the gut and biliary microbiota, microbiota. Subsequent PCoA analysis validated this finding,
DOI: https://doi.org/10.36922/jctr.23.00118