
Page 9 - JCTR-10-3
P. 9
Xie et al. | Journal of Clinical and Translational Research 2024; 10(3): 180-190 183
Table 2. Microflora sequencing results of each sample type
Statistical parameters Sample type
Gallstone Bile Gallbladder mucosa Patients’ feces Normal feces
Total number of sequences 1818953 + 1324611 + 2089573 + 2163367 # 3033379 #
Mean number of sequences 151579±80025 147179±62622 160736±58717 135210±56672 159651±40231
Total OTUs 4095 + 3065 + 4687 + 5203 # 6377 #
Mean OTUs 341±136 340±124 361±118 325±59 335±39
Chao1 434±131 + 416±119 + 445±120 + 418.15±51.50 # 411.18±49.15 #
Shannon’s index 3.77±1.66 + 4.08±1.91 + 3.75±1.68 + 4.87±0.93 # 5.17±0.64 #
#
Simpson’s index 0.71±0.19* + 0.74±0.23* + 0.69±0.18* + 0.89±0.08 * 0.92±0.06 #
#
+
Notes: P > 0.05 between gallstone, bile, and gallbladder mucosa; P > 0.05 between patients’ feces and normal feces; *P < 0.05.
Abbreviation: OTU: Operational taxonomic unit
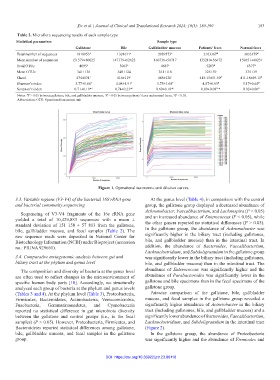
Figure 1. Operational taxonomic unit dilution curves.
3.3. Variable regions (V3-V4) of the bacterial 16S rRNA gene At the genus level (Table 4), in comparison with the control
and bacterial community sequencing group, the gallstone group displayed a decreased abundance of
Achromobacter, Faecalibacterium, and Lachnospira (P < 0.05)
Sequencing of V3-V4 fragments of the 16s rRNA gene
yielded a total of 10,429,883 sequences with a mean ± and an increased abundance of Enterococcus (P < 0.05), while
standard deviation of 151 158 ± 57 813 from the gallstone, the other genera reported no statistical differences (P > 0.05).
bile, gallbladder mucosa, and fecal samples (Table 2). The In the gallstone group, the abundance of Achromobacter was
raw sequence reads were deposited in National Center for significantly higher in the biliary tract (including gallstones,
Biotechnology Information (NCBI) under Bioproject (accession bile, and gallbladder mucosa) than in the intestinal tract. In
no.: PRJNA 929661). addition, the abundance of Bacteroides, Faecalibacterium,
Lachnoclostridium, and Subdoligranulum in the gallstone group
3.4. Comparative metagenomic analysis between gut and was significantly lower in the biliary tract (including gallstones,
biliary tract at the phylum and genus level bile, and gallbladder mucosa) than in the intestinal tract. The
The composition and diversity of bacteria at the genus level abundance of Enterococcus was significantly higher and the
are often used to reflect changes in the microenvironment of abundance of Parabacteroides was significantly lower in the
specific human body parts [18]. Accordingly, we structurally gallstone and bile specimens than in the fecal specimens of the
analyzed each group of bacteria at the phylum and genus levels gallstone group.
(Tables 3 and 4). At the phylum level (Table 3), Proteobacteria, Pairwise comparison of the gallstone, bile, gallbladder
Firmicutes, Bacteroidetes, Actinobacteria, Verrucomicrobia, mucosa, and fecal samples in the gallstone group revealed a
Fusobacteria, Gemmatimonadetes, and Cyanobacteria significantly higher abundance of Acinetobacter in the biliary
reported no statistical difference in gut microbiota diversity tract (including gallstones, bile, and gallbladder mucosa) and a
between the gallstone and control groups (i.e., in the fecal significantly lower abundance of Bacteroides, Faecalibacterium,
samples) (P > 0.05). However, Proteobacteria, Firmicutes, and Lachnoclostridium, and Subdoligranulum in the intestinal tract
Bacteroidetes reported statistical differences among gallstone, (Figure 2).
bile, gallbladder mucosa, and fecal samples in the gallstone In the gallstone group, the abundance of Proteobacteria
group. was significantly higher and the abundance of Firmicutes and
DOI: https://doi.org/10.36922/jctr.23.00118