
Page 37 - JCTR-10-4
P. 37
Yoksa, et al. | Journal of Clinical and Translational Research 2024; 10(4): 256-262 259
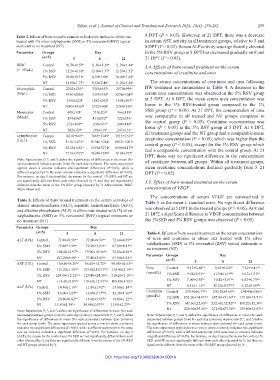
Table 2. Effects of burn wound treatment on leukocyte indices in albino rats 8 DPT (P < 0.05). However, at 21 DPT, there was a decrease
treated with 1% silver sulphadiazine (SSD) or 5% resveratrol (RSV) topical in serum AST activity in all treatment groups, relative to 5 and
ointments or no treatment (NT) 8 DPT (P > 0.05). Serum ALP activity was significantly elevated
Parameter Groups Day in the 5% RSV group at 5 DPT but decreased gradually on 8 and
(n=5) 5 8 21 21 DPT (P < 0.05).
WBC Control 10.78±1.57 a 11.60±1.29 a 11.20±1.44 a 3.4. Effects of burn wound treatment on the serum
3
(× 10 /µL) 1% SSD 12.20±1.68 a 12.00±1.37 a 12.50±1.32 a concentrations of creatinine and urea
5% RSV 10.00±2.18 a 8.90±1.08 a 10.40±1.64 a
NT 11.00±1.73 a 8.60±2.46 a 11.20±1.44 a The serum concentrations of creatinine and urea following
Neutrophils Control 2262±136 ab 3355±557 a 2879±999 a BW treatment are summarized in Table 4. A decrease in the
(N/µL) 1% SSD 3936±2086 a 3395±336 a 3274±1047 a serum urea concentration was observed in the 5% RSV group
5% RSV 1556±620 b 1081±692 b 1688±507 b at 5 DPT. At 8 DPT, the mean serum urea concentration was
NT 2980±1456 ab 2727±908 a 2789±559 a lower in the 5% RSV-treated group compared to the 1%
Monocytes Control 408±311 a 510±203 a 366±118 a SSD group (P < 0.05). At 21 DPT, the concentration of urea
(M/µL) 1% SSD 154±142 b 411±152 ab 322±246 a was comparable in all treated and NT groups compared to
5% RSV 232±168 ab 230±161 b 206±118 a the control group (P > 0.05). Creatinine concentration was
NT 302±129 a 206±119 c 247±161 a lower (P < 0.05) in the 5% RSV group at 5 DPT. At 8 DPT,
Lymphocytes Control 8218±665 a 7685±1049 a 7915±1615 a all treatment groups and the NT group had a comparable mean
(L/µL) 1% SSD 8110±1233 a 8194±1054 a 8852±1001 a creatinine concentration (P > 0.05), which was higher than the
5% RSV 8212±1681 a 5696±3271 a 8506±1173 a control group (P < 0.05), except for the 5% RSV group which
had a comparable concentration with the control group. At 21
NT 7718±1572 a 5624±1650 a 8164±975 a DPT, there was no significant difference in the concentration
Note: Superscripts ( , , and ) define the significance of differences in the mean (for of creatinine between all groups. Within all treatment groups,
a
b
c
each parameter) between groups (row) for each day (column). The same superscript
applied down a column indicates non-significant differences (P>0.05), while a mean creatinine concentrations declined gradually from 5–21
different superscript in the same column indicates a significant difference (P<0.05). DPT (P < 0.05).
For instance, on day 8 (neutrophils), the means for the control, 1% SSD, and NT are
not significantly different from each other (denoted by ), and they are significantly 3.5. Effect of burn wound treatment on the serum
a
different from the mean of the 5% RSV group (denoted by ). Abbreviation: WBC:
b
White blood cell. concentration of VEGF
The concentrations of serum VEGF are summarized in
Table 3. Effects of burn wound treatment on the serum activities of
alanine aminotransferase (ALT), aspartate aminotransferase (AST), Table 5 as the mean ± standard error. No significant difference
and alkaline phosphatase (ALP) in albino rats treated with 1% silver was observed at 5 DPT in the treated groups (P > 0.05). At 8 and
sulphadiazine (SSD) or 5% resveratrol (RSV) topical ointments or 21 DPT, a significant difference in VEGF concentration between
no treatment (NT) the 1%SSD and 5% RSV groups was observed (P < 0.05).
Parameter Groups Day
(n=5) 5 8 21 Table 4. Effects of burn wound treatment on the serum concentrations
ALT (U/L) Control 72.40±9.50 a,x 72.00±8.51 a,x 73.60±4.39 a,x of urea and creatinine in albino rats treated with 1% silver
1% SSD 79.80±1.92 a,x 79.20±3.65 a,x 67.80±4.15 a,y sulphadiazine (SSD) or 5% resveratrol (RSV) topical ointments or
no treatment (NT)
5% RSV 108.60±2.97 b,x 79.00±16.46 a,y 72.60±4.56 a,y
NT 107.20±6.06 77.40±3.85 a,y 67.80±5.54 a,y Parameter Groups Day
b, x
(n=5)
AST (U/L) Control 100.40±8.26 a,x 86.40±14.72 a,x 90.80±44.63 a,x 5 8 21
1% SSD 115.20±1.92 bc,x 123.40±10.71 bc,x 110.40±2.19 a,y Urea Control 9.12±0.46 a,x 9.62±0.62 a,x 7.62±0.41 a,y
5% RSV 128.00±12.12 ac,x 129.40±24.30 c,x 110.20±1.10 a,x (mmol/L) 1% SSD 9.08±0.91 a,x 11.94±1.19 b,y 6.12±1.31 b,z
NT 114.60±5.07 c,x 118.60±12.93 bc,y 105.80±4.92 a,x 5% RSV 7.00±0.38 b,x 10.42±1.51 a,y 6.82±0.73 ab,x
ALP (U/L) Control 14.40±1.14 a,x 11.80±1.92 a,x 13.60±1.14 a,y NT 8.16±1.15 a,x 11.26±0.97 bc,y 6.52±0.58 ab,z
1% SSD 18.00±1.87 b,x 13.80±2.17 ab,y 13.20±1.30 a,z Creatinine Control 179.60±6.77 a,x 200.20±9.68 a,y 134.40±9.86 a,z
(µmol/L)
5% RSV 20.80±0.83 c,x 16.60±3.65 b,y 14.00±1.22 a,y 1% SSD 202.20±14.41 ac,x 287.80±51.93 b,y 115.00±18.71 a,z
NT 15.80±1.30 a,x 14.60±2.07 ab,y 11.00±2.23 b,z 5% RSV 147.60±22.68 b,x 232.60±52.82 ab,y 118.20±12.30 a,x
NT 220.60±33.56 c,x 271.00±37.36 b,x 149.80±51.07 a,y
c
Note: Superscripts ( , , and ) define the significance of differences in mean (for each
a b
z
x y
parameter) between groups (row) for each day (column); superscripts ( , , and ) define Note: Superscripts ( , , and ) define the significance of differences in mean (for each
c
a b
the significance of differences in mean (for each parameter) between days (column) parameter) between groups (row) for each day (column); superscripts ( , , and ) define
z
x y
for each group (row). The same superscript applied across a row (or down a column) the significance of differences in mean between days (column) for each group (row).
indicates non-significant differences (P>0.05), while a different superscript in the same The same superscript applied across a row (or down a column) indicates non-significant
row (or column) indicates a significant difference (P<0.05). For instance, on day 5 differences (P>0.05), while a different superscript in the same row (or column) indicates
(ALT), the means for the control and 1% SSD are not significantly different from each a significant difference (P<0.05). For instance, on day 5 (urea), the means for control, 1%
other (denoted by ), but they are significantly different from the means of the 5% RSV SSD, and NT are not significantly different from each other (denoted by ), but they are
a
a
and NT groups (denoted by ). significantly different from the mean of the 5% RSV group (denoted by ).
b
b
DOI: https://doi.org/10.36922/jctr.24.00019