
Page 51 - JCTR-11-2
P. 51
Journal of Clinical and
Translational Research CMV secular trends and race
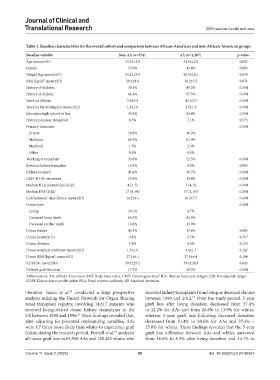
Table 1. Baseline characteristics for the overall cohort and comparison between African‑American and non‑African‑American groups
Baseline variable Non‑AA (n=974) AA (n=1,287) p‑value
Age (mean±SD) 53.3±13.8 51.6±12.8 0.002
Female 37.6% 43.4% 0.005
Weight (kg, mean±SD) 87.2±19.9 88.9±18.1 0.039
BMI (kg/m , mean±SD) 29.6±8.6 30.2±5.5 0.071
2
History of diabetes 38.5% 49.2% <0.001
History of dialysis 61.4% 87.3% <0.001
Years on dialysis 2.0±2.4 4.1±3.0 <0.001
Years on the waiting list (mean±SD) 1.4±1.8 1.6±1.9 <0.001
Education high school or less 35.4% 52.4% <0.001
History pancreas transplant 6.5% 7.1% 0.573
Primary insurance <0.001
Private 34.8% 16.2%
Medicare 62.9% 81.0%
Medicaid 1.5% 2.3%
Other 0.9% 0.6%
Working at transplant 33.6% 22.3% <0.001
Previous kidney transplant 10.5% 6.9% 0.003
Kidney pumped 45.6% 56.7% <0.001
CMV D+/R−serostatus 25.4% 14.4% <0.001
Median HLA mismatches (IQR) 4 (3, 5) 5 (4, 5) <0.001
Median PRA (IQR) 17 (0, 64) 37 (2, 83) <0.001
Cold ischemic time (hours, mean±SD) 14.2±9.1 16.3±7.7 <0.001
Donor type <0.001
Living 24.1% 4.7%
Deceased brain death 65.5% 82.3%
Deceased cardiac death 10.4% 13.0%
Donor female 43.3% 35.8% 0.003
Donor hepatitis C+ 3.4% 2.7% 0.357
Donor diabetes 5.4% 6.9% 0.130
Donor terminal creatinine (mean±SD) 1.3±1.0 1.4±1.5 0.162
2
Donor BMI (kg/m , mean±SD) 27.2±6.1 27.6±6.4 0.104
KDPI (%, mean±SD) 39.3±25.2 39.9±24.9 0.643
Delayed graft function 17.2% 28.3% <0.001
Abbreviations: AA: African Americans; BMI: Body mass index; CMV: Cytomegalovirus; HLA: Human leukocyte antigen; IQR: Interquartile range;
KDPI: Kidney donor profile index; PRA: Panel reactive antibody; SD: Standard deviation.
literature. Isaacs et al. conducted a large prospective received kidney transplants from living or deceased donors
23
analysis utilizing the United Network for Organ Sharing between 1990 and 2012. Over the study period, 5-year
17
renal transplant registry, involving 14,617 patients who graft loss after living donation decreased from 37.4%
received living-related donor kidney transplants in the to 22.2% for AAs and from 20.8% to 13.9% for whites,
US between 1988 and 1996. Their findings revealed that, whereas 5-year graft loss following deceased donation
23
after adjusting for potential confounding variables, AAs decreased from 51.4% to 30.6% for AAs and 37.3% –
were 1.7 times more likely than whites to experience graft 25.0% for whites. These findings revealed that the 5-year
17
failure during the research period. Purnell et al. analyzed graft loss difference between AAs and whites narrowed
all-cause graft loss in 63,910 AAs and 145,482 whites who from 16.6% to 8.3% after living donation and 14.1% to
Volume 11 Issue 2 (2025) 45 doi: 10.36922/jctr.24.00067