
Page 53 - JCTR-11-2
P. 53
Journal of Clinical and
Translational Research CMV secular trends and race
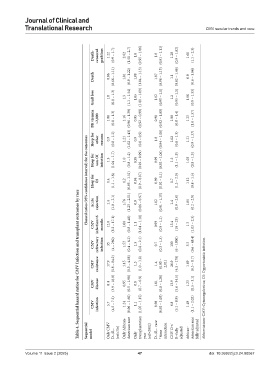
Death‑ censored graft loss 1.22 (0.9 – 1.7) 2.02 (1.51 – 2.7) 1.0 (0.95 – 1.06) 1.0 (0.91 – 1.11) 1.28 (0.9 – 1.82) 1.60 (1.1 – 2.3)
Death 0.86 (0.66 – 1.11) 1.01 (0.9 – 1.22) 1.08 (1.04 – 1.13) 1.07 (0.98 – 1.15) 1.1 (0.82 – 1.46) 0.8 (0.6 – 1.04)
Graft loss 1.0 (0.8 – 1.3) 1.3 (1.1 – 1.54) 1.05 (1.01 – 1.09) 1.02 (0.95 – 1.1) 1.2 (0.95 – 1.5) 1.08 (0.9 – 1.33)
BK viremia >2,000 1.06 (0.8 – 1.3) 1.16 (0.96 – 1.39) 0.95 (0.92 – 0.99) 0.98 (0.92 – 1.05) 1.08 (0.8 – 1.4) 1.25 (1.0 – 1.57)
Hosp for other reasons 0.9 (0.8 – 1.2) 1.21 (1.02 – 1.43) 0.9 (0.8 – 0.9) 1.0 (0.94 – 1.06) 1.02 (0.8 – 1.3) 1.11 (0.9 – 1.37)
Hazard ratios (95% confidence interval) for the outcomes
Hosp for non‑OI infection 1.3 (1.04 – 1.7) 1.0 (0.8 – 1.2) 0.95 (0.92 – 0.99) 0.99 (0.92 – 1.06) 1.5 (1.1 – 1.9) 1.03 (0.8 – 1.3)
Hosp for OI 1.4 (1.1 – 1.8) 1.2 (0.95 – 1.51) 0.94 (0.9 – 0.97) 0.99 (0.92 – 1.1) 1.7 (1.3 – 2.3) 1.12 (0.8 – 1.5)
Table 4. Sequential hazard ratios for CMV Infection and transplant outcomes by race
Acute rejection 1.4 (1.0 – 2.1) 1.76 (1.23 – 2.51) 0.9 (0.86 – 0.97) 1.02 (0.91 – 1.15) 1.4 (0.9 – 2.0) 1.85 (0.2 – 2.9)
CMV infection>6 months 12.0 (8.3 – 17.1) 1.06 (0.8 – 1.48) 1.1 (1.04 – 1.18) 0.99 (0.9 – 1.1) 15.4 (10 – 23) 1.5 (1.03 – 2.3)
CMV refractory infection 35 (4 – 280) 1.53 (0.4 – 6.1) 1.3 (0.8 – 2.1) 0.7 (0.3 – 1.3) 100 (6 – 1800) 5.5 (0.6 – 48.4)
CMV resistance 17.9 (3.8 – 84.2) 1.15 (0.3 – 4.08) 1.3 (1.0 – 1.8) 1.4 (0.95 – 2.01) 26.9 (4.3 – 170) 1.69 (0.3 – 8.7)
CMV disease 8.4 (3.9 – 18.0) 0.95 (0.5 – 1.98) 0.8 (0.7 – 0.9) 1.01 (0.8 – 1.28) 13.9 (5.6 – 34.5) 1.23 (0.5 – 3.1) Abbreviations: CMV: Cytomegalovirus; OI: Opportunistic infection.
CMV infection 5.7 (4.5 – 7.3) 1.24 (0.96 – 1.60) 1.1 (1.05 – 1.15) 0.98 (0.92 – 1.05) 6.8 (5.1 – 8.9) 1.49 (1.1 – 2.02)
Sequential model Only CMV D+/R− (ref=No) Only African- American race Only transplantation year (ref=2012) D+/R− race * time interaction CMV D+/ R−fully adjusted African- American race fully adjusted
Volume 11 Issue 2 (2025) 47 doi: 10.36922/jctr.24.00067