
Page 52 - JCTR-11-2
P. 52
Journal of Clinical and
Translational Research CMV secular trends and race
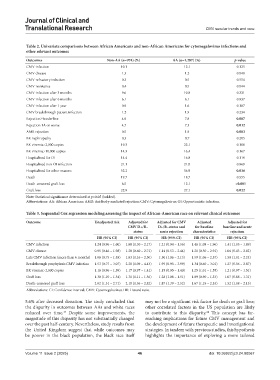
Table 2. Univariate comparisons between African Americans and non‑African Americans for cytomegalovirus infections and
other relevant outcomes
Outcomes Non‑AA (n=974) (%) AA (n=1,287) (%) p‑value
CMV infection 10.1 12.1 0.125
CMV disease 1.3 1.2 0.848
CMV refractory infection 0.3 0.5 0.554
CMV resistance 0.4 0.5 0.844
CMV infection after 3 months 9.6 10.8 0.331
CMV infection after 6 months 6.1 6.1 0.937
CMV infection after 1 year 0.9 1.6 0.187
CMV breakthrough patient infection 1.2 1.9 0.234
Rejection≥borderline 4.9 7.8 0.007
Rejection 1A or worse 4.7 7.3 0.012
AMR rejection 0.5 1.9 0.003
BK nephropathy 0.3 0.7 0.205
BK viremia>2,000 copies 19.3 22.1 0.100
BK viremia>10,000 copies 14.3 16.4 0.167
Hospitalized for OI 14.4 16.8 0.119
Hospitalized non-OI infection 21.1 21.0 0.969
Hospitalized for other reasons 52.2 56.9 0.026
Death 19.7 18.7 0.555
Death-censored graft loss 6.5 12.1 <0.001
Graft loss 22.9 27.1 0.022
Note: Statistical significance determined at p<0.05 (bolded).
Abbreviations: AA: African American; AMR: Antibody-mediated rejection; CMV: Cytomegalovirus; OI: Opportunistic infection.
Table 3. Sequential Cox regression modeling assessing the impact of African‑American race on relevant clinical outcomes
Outcome Unadjusted risk Adjusted for Adjusted for CMV Adjusted Adjusted for
CMV D+/R− D+/R−status and for baseline baseline and acute
status acute rejection characteristics rejection
HR (95% CI) HR (95% CI) HR (95% CI) HR (95% CI) HR (95% CI)
CMV infection 1.24 (0.96 – 1.60) 1.68 (1.30 – 2.17) 1.21 (0.94 – 1.56) 1.46 (1.08 – 1.96) 1.41 (1.05 – 1.89)
CMV disease 0.95 (0.46 – 1.98) 1.28 (0.60 – 2.71) 1.14 (0.53 – 2.44) 1.21 (0.50 – 2.91) 1.06 (0.43 – 2.62)
Late CMV infection (more than 6 months) 1.06 (0.75 – 1.48) 1.63 (1.16 – 2.30) 1.50 (1.06 – 2.13) 1.59 (1.06 – 2.37) 1.50 (1.01 – 2.24)
Breakthrough prophylaxis CMV infection 1.53 (0.77 – 3.07) 2.20 (1.09 – 4.43) 1.95 (0.95 – 3.99) 1.34 (0.60 – 3.01) 1.27 (0.56 – 2.87)
BK viremia>2,000 copies 1.16 (0.96 – 1.39) 1.17 (0.97 – 1.41) 1.15 (0.95 – 1.40) 1.25 (1.01 – 1.55) 1.21 (0.97 – 1.51)
Graft loss 1.30 (1.10 – 1.54) 1.31 (1.11 – 1.56) 1.28 (1.08 – 1.51) 1.09 (0.90 – 1.33) 1.07 (0.88 – 1.31)
Death-censored graft loss 2.02 (1.51 – 2.71) 2.10 (1.56 – 2.82) 1.87 (1.39 – 2.52) 1.67 (1.19 – 2.33) 1.52 (1.08 – 2.15)
Abbreviations: CI: Confidence interval; CMV: Cytomegalovirus; HR: Hazard ratio.
5.6% after deceased donation. The study concluded that may not be a significant risk factor for death or graft loss;
the disparity in outcomes between AAs and white races other correlated factors in the US population are likely
reduced over time. Despite some improvements, the to contribute to this disparity. This concept has far-
24
17
magnitude of this disparity has not substantially changed reaching implications for future CMV management and
over the past half-century. Nevertheless, study results from the development of future therapeutic and investigational
the United Kingdom suggest that while outcomes may strategies. In tandem with previous studies, this hypothesis
be poorer in the black population, the black race itself highlights the importance of exploring a more tailored
Volume 11 Issue 2 (2025) 46 doi: 10.36922/jctr.24.00067