
Page 88 - JCTR-11-5
P. 88
Journal of Clinical and
Translational Research ROCK inhibition in chronic rejection
3. Results Supplements were already published in our previous
publication. All genes considered differentially expressed
10
In all our analyses, we purposely used non-activated (M0) compared to the control (DMSO-treated) cells had a
macrophages. M0 (or naïve) macrophages are in a resting p≤0.05 and ‖log fold change‖ > 0. Pathways associated with
2
state and serve as precursors to polarized macrophages. these DEGs were identified using Metascape.
It is known that the transcription and protein expression
profiles of activated macrophages depend on the type 3.2. Effect of Rezurock/fingolimod combination on
(direction) of polarization (M1 vs. M2), and particularly mouse peritoneal macrophages
on the specific type of activator. In addition, our previous The combination treatment of macrophages with Rezurock
research showed that the response of M0 macrophages and fingolimod resulted in the differential expression of
to RhoA/ROCK inhibition is very similar to that of 4,855 genes (2,477 downregulated and 2,378 upregulated)
M2 macrophages but differs from the response of M1 compared to the DMSO control (Figure 2A). In the volcano
macrophages. Both M0 and M2 macrophages exhibit plot, green dots represent upregulated genes, whereas red
high levels of RhoA messenger RNA (mRNA), whereas dots represent downregulated genes. The distribution
M1 macrophages express RhoA mRNA at approximately of the DEGs is depicted in the heatmap (Figure 2B).
three times lower levels. Thus, to obtain “basic” or naïve The downregulated genes were related to the cell cycle,
11
transcriptomic and proteomic data, we chose to use non- DNA metabolic processes, neutrophil degranulation,
activated (M0) macrophages. chromosome organization, leukocyte proliferation, and
cytokine production (Figure 2C; Tables S1 and S2). The
3.1. RNA sequencing upregulated genes were associated with protein processing,
We performed RNA sequencing of mouse peritoneal membrane trafficking, Rho GTPase signaling, autophagy,
macrophages after combined treatment with Rezurock Golgi organization, neuron projection development, and
and fingolimod. The data were then compared with our histone modification (Figure 2D; Tables S3 and S4).
previously published results from individual treatments Our previously published work showed that
with Rezurock or fingolimod in mouse peritoneal Rezurock is superior to fingolimod in modulating the
macrophages. A schematic representation of the workflow transcriptome profile of mouse peritoneal macrophages
10
is shown in Figure 1. Figure S1A displays the distribution and in regulating fibrosis pathway-related proteins in
of control (DMSO-treated), Rezurock-only, and Rezurock/ both mouse macrophages and human monocyte-derived
fingolimod-treated macrophages. Figure S1B shows a macrophages. Here, we show that 1,751 genes were
10
box plot representing gene expression distribution in shared between Rezurock-treated macrophages and the
control (DMSO-treated) and Rezurock/fingolimod- combination of Rezurock/fingolimod, 726 genes were
treated macrophages. Some of the data presented in the downregulated only after the combination treatment,
A C
D
B
E
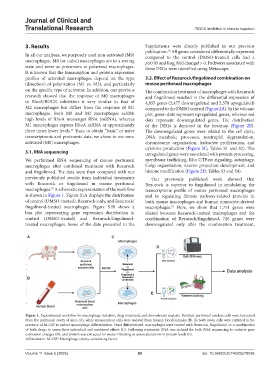
Figure 1. Experimental workflow for macrophage isolation, drug treatment, and downstream analysis. Resident peritoneal exudate cells were harvested
from the peritoneal cavity of mice (A), while mononuclear cells were isolated from human blood samples (B). In both cases, cells were cultured in the
presence of M-CSF to induce macrophage differentiation. Once differentiated, macrophages were treated with Rezurock, fingolimod, or a combination
of both drugs to assess their individual and combined effects (C). Following treatment, RNA was isolated for bulk RNA sequencing to evaluate gene
expression changes (D), and protein was extracted for western blotting to assess alterations in protein levels (E).
Abbreviation: M-CSF: Macrophage colony-stimulating factor.
Volume 11 Issue 5 (2025) 82 doi: 10.36922/JCTR025270036