
Page 89 - JCTR-11-5
P. 89
Journal of Clinical and
Translational Research ROCK inhibition in chronic rejection
A B
C
D
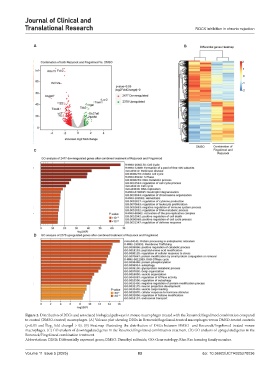
Figure 2. Distribution of DEGs and associated biological pathways in mouse macrophages treated with the Rezurock/fingolimod combination compared
to control (DMSO-treated) macrophages. (A) Volcano plot showing DEGs in Rezurock/fingolimod-treated macrophages versus DMSO-treated controls
(p<0.05 and ‖log fold change‖ > 0). (B) Heatmap illustrating the distribution of DEGs between DMSO- and Rezurock/fingolimod-treated mouse
2
macrophages. (C) GO analysis of downregulated genes in the Rezurock/fingolimod combination treatment. (D) GO analysis of upregulated genes in the
Rezurock/Fingolimod combination treatment.
Abbreviations: DEGS: Differentially expressed genes; DMSO: Dimethyl sulfoxide; GO: Gene ontology; Rho: Ras homolog family member.
Volume 11 Issue 5 (2025) 83 doi: 10.36922/JCTR025270036