
Page 26 - JCTR-9-4
P. 26
242 Marchand et al. | Journal of Clinical and Translational Research 2023; 9(4): 236-245
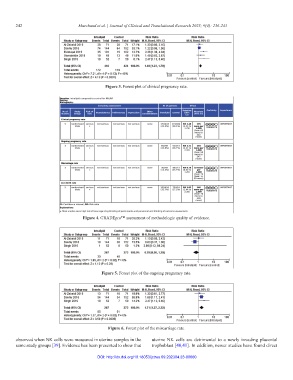
Figure 3. Forest plot of clinical pregnancy rate.
Figure 4. GRADEpro™ assessment of methodologic quality of evidence.
Figure 5. Forest plot of the ongoing pregnancy rate.
Figure 6. Forest plot of the miscarriage rate.
observed when NK cells were measured in uterine samples in the uterine NK cells are detrimental to a newly invading placental
same study groups [39]. Evidence has been presented to show that trophoblast [40,41]. In addition, newer studies have found direct
DOI: http://dx.doi.org/10.18053/jctres.09.202304.23-00060