
Page 52 - JCTR-9-4
P. 52
268 Seetharam et al. | Journal of Clinical and Translational Research 2023; 9(4):265-271
Table 1. Baseline characteristics of the study population (n=138) Table 3. Spearman’s correlation of QoL scores (PCS-12 and MCS-12)
Characteristics Mean±SD with left ventricular ejection fraction
Mean age (years) 54.3±10.7 QoL scores Spearman’s LVEF (%) LVEF (%) LVEF (%)
BMI (Kg/m ) 25.2±4.0 rho (1 month) (3 months) (6 months)
2
Killip classification PCS 12 Correlation 0.57
Class I 118 (1 month) coefficient
Class II 01 P-value 0.000**
Class III 05 PCS 12 Correlation 0.35
Class IV 03 (3 months) coefficient
Clinical data P-value 0.000**
Systolic blood pressure (mmHg) 128±24 PCS 12 Correlation 0.31
Diastolic blood pressure (mmHg) 80±11 (6 months) coefficient
Heart rate (bpm) 82±13 P-value 0.000**
Left ventricular ejection fraction (%) 45±10 MCS 12 Correlation 0.31
Cardiovascular risk factors (1 month) coefficient
Diabetes mellitus, n (%) 36 (26) P-value 0.000**
Hypertension, n (%) 50 (37) MCS 12 Correlation 0.16
Smoking, n (%) 42 (31) (3 months) coefficient
Alcohol consumption, n (%) 21 (15) P-value 0.068
Tobacco chewing, n (%) 05 (4) MCS 12 Correlation 0.25
Coronary angiography and PCI data (n) (6 months) coefficient
Primary PCI 79 P-value 0.004**
Rescue PCI 01 *Moderately significant P≤0.05; **Strongly significant P≤0.01; NS: Not significant;
Elective PCI 58 QoL: Quality of life; PCS: Physical component score; MCS: Mental component score
TIMI flow grade III (post-PCI) 138
TIMI: Thrombolysis in myocardial infarction; PCI: Percutaneous coronary intervention Table 4. Spearman’s correlation of QoL scores with age and body mass
index
Table 2. Quality of life scores after percutaneous coronary intervention QoL scores Spearman’s rho Age (years) BMI (kg/m )
2
using Friedman’s test PCS 12 Correlation coefficient −0.19 0.06
QoL 1‑month 3‑month 6‑month Chi‑square P‑value (1 month) P-value 0.029* 0.502 NS
scores post‑PCI post‑PCI post‑PCI value MCS 12
−0.19
0.20
PCS-12 53.07 54.00 54.00 8.97 0.011* (1 month) Correlation coefficient 0.024* 0.022*
P-value
MCS-12 55.96 57.00 56.00 3.43 0.180 NS
*Significance P≤0.05; NS: Not significant; BMI: Body mass index; QoL: Quality of life;
Values expressed as median; *Significance P≤0.05; NS: Not significant; QoL: Quality of PCS: Physical component score; MCS: Mental component score.
life; PCS-12: Physical component score; MCS-12: Mental component score.
Table 5. Multivariate tests between smoking, tobacco chewing, alcohol
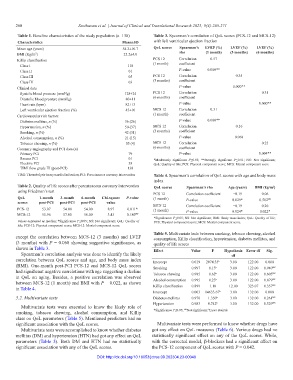
except the correlation between MCS-12 (3 months) and LVEF consumption, Killip classification, hypertension, diabetes mellitus, and
(3 months) with P = 0.068 showing suggestive significance, as quality of life scores
shown in Table 3. Effect Value F Hypothesis Error df Sig.
Spearman’s correlation analysis was done to identify the likely df
correlation between QoL scores and age, and body mass index Intercept 0.019 2074.35 b 3.00 122.00 0.000
(BMI). One-month post-PCI PCS-12 and MCS-12 QoL scores Smoking 0.997 0.13 b 3.00 122.00 0.940 NS
had significant negative correlations with age suggesting a decline Tobacco chewing 0.985 0.62 b 3.00 122.00 0.605 NS
in QoL on aging. Besides, a positive correlation was observed Alcohol consumption 0.995 0.23 b 3.00 122.00 0.879 NS
between MCS-12 (1 month) and BMI with P = 0.022, as shown Killip classification 0.899 1.10 12.00 323.07 0.357 NS
in Table 4.
Intercept 0.003 14633.67 b 3.00 132.00 0.000
3.2. Multivariate tests Diabetes mellitus 0.970 1.350 b 3.00 132.00 0.261 NS
Hypertension 0.983 0.742 b 3.00 132.00 0.529 NS
Multivariate tests were executed to know the likely role of
NS
b
smoking, tobacco chewing, alcohol consumption, and Killip *Significance P≤0.05; Not significant; Exact statistic
class on QoL parameters (Table 5). Mentioned predictors had no
significant association with the QoL scores. Multivariate tests were performed to know whether drugs have
Multivariate tests were accomplished to know whether diabetes got any effect on QoL measures (Table 6). Various drugs had no
mellitus (DM) and hypertension (HTN) had got any effect on QoL statistically significant effect on any of the QoL scores. While,
parameters (Table 5). Both DM and HTN had no statistically with the corrected model, β-blockers had a significant effect on
significant association with any of the QoL scores. the PCS-12 component of QoL scores with P = 0.042.
DOI: http://dx.doi.org/10.18053/jctres.09.202304.23-00049