
Page 60 - JCTR-9-4
P. 60
276 Li et al. | Journal of Clinical and Translational Research 2023; 9(4): 272-281
Table 1. (Continued)
Characteristics Number of patients Percentage
PD-L1-positive
≥1 17 37.8 (17/45)
<1 20 44.4 (20/45)
0 8 17.8 (8/45)
Ki-67-positive
<75 14 23.7 (14/59)
≥75 45 76.3 (45/59)
3DCRT: 3D conformal radiotherapy; IMRT: Intensity-modulated radiotherapy; CCRT: Concurrent chemo radiotherapy; EP: Etoposide-platinum; TP: Paclitaxel-platinum; CgA: Chromogranin
A, Syn: Synaptophysin
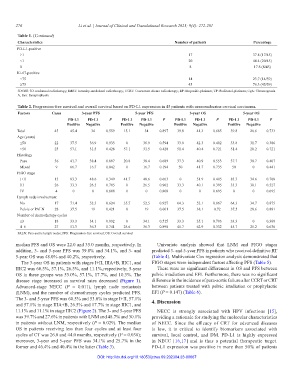
Table 2. Progression-free survival and overall survival based on PD-L1 expression in 45 patients with neuroendocrine cervical carcinoma.
Factors Cases 3‑year PFS 5‑year PFS 3‑year OS 5‑year OS
PD‑L1 PD‑L1 P PD‑L1 PD‑L1 P PD‑L1 PD‑L1 P PD‑L1 PD‑L1 P
Positive Negative Positive Negative Positive Negative Positive Negative
Total 45 45.4 34 0.559 15.1 34 0.897 39.8 41.3 0.685 39.8 26.6 0.733
Age (years)
≤50 22 37.5 36.9 0.933 0 36.9 0.594 33.8 42.3 0.402 33.8 31.7 0.386
>50 23 57.1 31.5 0.428 57.1 31.5 0.428 51.4 40.4 0.721 51.4 20.2 0.721
Histology
Pure 36 41.7 38.4 0.897 20.8 38.4 0.689 37.3 40.9 0.553 37.7 30.7 0.407
Mixed 9 66.7 16.7 0.042 0 16.7 0.194 50 41.7 0.735 50 0 0.441
FIGO stage
I+II 15 83.3 48.6 0.349 41.7 48.6 0.663 0 51.9 0.405 83.3 34.6 0.708
III 26 33.3 26.5 0.705 0 26.5 0.902 33.3 40.1 0.395 33.3 30.1 0.527
IV 4 0 0 0.808 0 0 0.808 0 0 0.695 0 0 0.695
Lymph node involvement
No 17 71.4 52.5 0.624 35.7 52.5 0.927 64.3 52.1 0.867 64.3 34.7 0.875
Pelvic or PALN 28 37.5 19 0.421 0 19 0.601 37.5 38.1 0.72 37.5 28.6 0.881
Number of chemotherapy cycles
≤3 18 33.3 34.1 0.892 0 34.1 0.515 33.3 35.1 0.703 33.3 0 0.368
4–6 27 51.3 36.3 0.741 25.6 36.3 0.890 45.7 62.9 0.332 45.7 25.2 0.636
PALN: Para-aortic lymph nodes; PFS: Progression-free survival; OS: Overall survival
median PFS and OS were 22.0 and 35.0 months, respectively. In Univariate analysis showed that LNM and FIGO stages
addition, 3- and 5-year PFS was 39.8% and 34.1%, and 3- and predicted 3- and 5-year PFS in patients who received definitive RT
5-year OS was 48.0% and 40.2%, respectively. (Table 4). Multivariate Cox regression analysis demonstrated that
The 3-year OS in patients with stages I+II, IIIA+B, IIIC1, and FIGO stages were independent factors affecting PFS (Table 5).
IIIC2 was 60.5%, 57.1%, 26.5%, and 11.1%,respectively; 5-year There were no significant differences in OS and PFS between
OS in these groups was 53.0%, 57.1%, 17.7%, and 10.3%. The pelvic irradiation and EFI. Furthermore, there was no significant
disease stage increased as survival rates decreased (Figure 1). difference in the incidence of para-aortic failure after CCRT or CRT
Advanced-stage NECC (P = 0.011), lymph node metastasis between patients treated with pelvic irradiation or prophylactic
(LNM), and the number of chemotherapy cycles predicted PFS. EFI (P = 0.147) (Table 6).
The 3- and 5-year PFS was 60.5% and 53.0% in stage I+II, 57.1% 4. Discussion
and 57.1% in stage IIIA+B, 26.5% and 17.7% in stage IIIC1, and
11.1% and 11.1% in stage IIIC2 (Figure 2). The 3- and 5-year PFS NECC is strongly associated with HPV infections [15],
was 39.7% and 27.6% in patients with LNM and 48.7% and 30.1% providing a rationale for studying the molecular characteristics
in patients without LNM, respectively (P = 0.029). The median of NECC. Since the efficacy of CRT for advanced diseases
OS in patients receiving less than four cycles and at least four is low, it is critical to identify biomarkers associated with
cycles of CT was 26.0 and 44.0 months, respectively (P = 0.038); survival, local control, and DM. PD-L1 is highly expressed
moreover, 3-year and 5-year PFS was 34.1% and 25.7% in the in NECC [16,17] and is thus a potential therapeutic target.
former and 46.4% and 40.4% in the latter (Table 3). PD-L1 expression was positive in more than 50% of patients
DOI: http://dx.doi.org/10.18053/jctres.09.202304.23-00067