
Page 63 - JCTR-9-4
P. 63
Li et al. | Journal of Clinical and Translational Research 2023; 9(4): 272-281 279
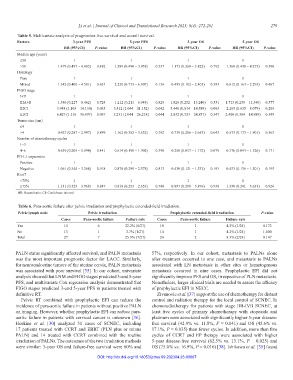
Table 5. Multivariate analysis of progression-free survival and overall survival.
Factors 3‑year PFS 5‑year PFS 3‑year OS 5‑year OS
HR (95%CI) P‑value HR (95%CI) P‑value HR (95%CI) P‑value HR (95%CI) P‑value
Median age (years)
≤50 1 1 1 1
>50 1.479 (0.497 – 4.405) 0.482 1.389 (0.490 – 3.938) 0.537 1.173 (0.360 – 3.822) 0.792 1.368 (0.438 – 4.275) 0.590
Histology
Pure 1 1 1 1
Mixed 1.342 (0.400 – 4.501) 0.633 2.250 (0.733 – 6.907) 0.156 0.495 (0.102 – 2.405) 0.383 0.612 (0.163 – 2.295) 0.467
FIGO stage
I+II 1 1 1 1
IIIA+B 1.386 (0.227 – 8.462) 0.724 1.212 (0.211 – 6.948) 0.829 1.826 (0.252 – 13.240) 0.551 1.713 (0.259 – 11.340) 0.577
IIIC1 3.948 (1.103 – 14.130) 0.035 3.412 (1.044 – 11.152) 0.042 3.446 (0.814 – 14.589) 0.093 2.265 (0.635 – 8.079) 0.208
IIIC2 6.427 (1.116 – 36.997) 0.037 5.231 (1.044 – 26.218) 0.044 2.832 (0.323 – 24.837) 0.347 2.400 (0.384 – 14.989) 0.349
Tumor size (cm)
≤4 1 1 1 1
>4 0.927 (0.287 – 2.997) 0.899 1.162 (0.382 – 3.532) 0.792 0.739 (0.206 – 2.653) 0.643 0.573 (0.173 – 1.901) 0.363
Number of chemotherapy cycles
1–3 1 1 1 1
4–6 0.639 (0.205 – 1.994) 0.441 0.614 (0.198 – 1.902) 0.398 0.258 (0.057 – 1.172) 0.079 0.376 (0.093 – 1.526) 0.171
PD-L1 expression
Positive 1 1 1 1
Negative 1.061 (0.344 – 3.268) 0.918 0.878 (0.299 – 2.578) 0.813 0.430 (0.121 – 1.532) 0.193 0.453 (0.136 – 1.501) 0.195
Ki-67
<75% 1 1 1 1
≥75% 1.131 (0.323 – 3.968) 0.847 0.819 (0.253 – 2.653) 0.740 0.897 (0.208 – 3.876) 0.938 1.330 (0.241 – 3.653) 0.926
HR: Hazard ratio; CI: Confidence interval
Table 6. Para-aortic failure after pelvic irradiation and prophylactic extended-field irradiation.
Pelvic lymph node Pelvic irradiation Prophylactic extended‑field irradiation P‑value
Cases Para‑aortic failure Failure rate Cases Para‑aortic failure Failure rate
Yes 14 6 22.2% (6/27) 10 1 4.2% (1/24) 0.172
No 13 1 3.7% (1/27) 14 1 4.2% (1/24) 1.000
Total 27 7 25.9% (7/27) 24 2 8.3% (2/24) 0.147
PALN status significantly affected survival, and PALN metastasis 57%, respectively. In our cohort, metastasis to PALNs alone
was the most important prognostic factor for LACC. Similarly, after treatment occurred in one case, and metastasis to PALNs
for neuroendocrine tumors of the uterine cervix, PALN metastasis associated with LN metastasis in other sites or hematogenous
was associated with poor survival [35]. In our cohort, univariate metastasis occurred in nine cases. Prophylactic EFI did not
analysis showed that LNM and FIGO stages predicted 3-and 5-year significantly improve PFS and OS, irrespective of PLN metastasis.
PFS, and multivariate Cox regression analysis demonstrated that Nonetheless, larger clinical trials are needed to assess the efficacy
FIGO stages predicted 3-and 5-year PFS in patients treated with of prophylactic EFI in NECC.
definitive RT. Zivanovic et al. [37] support the use of chemotherapy for distant
Pelvic RT combined with prophylactic EFI can reduce the control and radiation therapy for the local control of SCNEC. In
incidence of para-aortic failure in patients without positive PALN chemoradiotherapy for patients with stage IIB-IVB SCNEC, at
on imaging. However, whether prophylactic EFI can reduce para- least five cycles of primary chemotherapy with etoposide and
aortic failure in patients with cervical cancer is unknown [36]. platinum were associated with significantly higher 5-year disease-
Hoskins et al. [30] analyzed 31 cases of SCNEC, including free survival (42.9% vs. 11.8%, P = 0.041) and OS (45.6% vs.
17 patients treated with CCRT and EBRT (PLN plus or minus 17.1%, P = 0.035) than fewer cycles. In addition, more than five
PALN) and 14 treated with CCRT combined with the routine cycles of CCRT and EP therapy were associated with higher
irradiation of PALNs. The outcomes of the two irradiation methods 5-year disease-free survival (62.5% vs. 13.1%, P = 0.025) and
were similar: 3-year OS and failure-free survival were 60% and OS (75.0% vs. 16.9%, P = 0.016) [38]. Ishikawa et al. [35] found
DOI: http://dx.doi.org/10.18053/jctres.09.202304.23-00067