
Page 61 - JCTR-9-4
P. 61
Li et al. | Journal of Clinical and Translational Research 2023; 9(4): 272-281 277
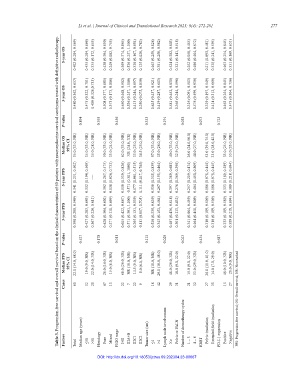
Table 3. Progression-free survival and overall survival based on the clinical characteristics of 60 patients with neuroendocrine cervical carcinoma treated with definitive radiotherapy.
5‑year OS 0.402 (0.284, 0.569) 0.435 (0.284, 0.666) 0.335 (0.172, 0.655) 0.438 (0.304, 0.630) 0.249 (0.082, 0.755) 0.569 (0.374, 0.865) 0.536 (0.257, 1.000) 0.330 (0.167, 0.654) 0.125 (0.020, 0.782) 0.463 (0.259, 0.826) 0.381 (0.250, 0.582) 0.524 (0.382, 0.803) 0.321 (0.141, 0.518) 0.252 (0.058, 0.455) 0.486 (0.464, 0.872) 0.211 (0.093, 0.481) 0.338 (0.241, 0.595) 0.463 (0.254, 0.845) 0.331 (0.169, 0.651)
3‑year OS 0.480 (0.362, 0.637) 0.475 (0.322, 0.701) 0.489 (0.326,0.733) 0.508 (0.377, 0.685) 0.373 (0.173, 0.806) 0.650 (0.468, 0.902) 0.536 (0.257, 1.000) 0.413 (0.244, 0.697) 0.250 (0.075, 0.830) 0.635 (0.437, 0.921) 0.419 (0.287, 0.613) 0.581 (0.452, 0.838) 0.365 (0.244, 0.596) 0.316 (0.091, 0.513) 0.576 (0.599, 0.930) 0.329 (0.197, 0.549) 0.414 (0.312, 0.660) 0.463 (0.254, 0.845) 0.473 (0.304, 0.736)
P‑value 0.894 0.393 0.456 0.333 0.191 0.038 0.073 0.723
Median OS 95% CI 35.0 (33.0, NR) 35.0 (33.0, NR) 35.0 (28.0, NR) 50.0 (33.0, NR) 33.0 (24.0, NR) 62.0 (33.0, NR) NR (24.0, NR) 33.0 (25.0, NR) 34.5 (25.0, NR) 57.0 (33.0, NR) 35.0 (26.0, NR) 40.0 (33.0, NR) 32.9 (25.0, NR) 26.0 (24.0,50.0) 44.0 (27.0, NR) 53.0 (39.0,75.0) 33.0 (28.0,42.0) 33.0 (25.0, NR) 35.0 (33.0, NR)
5‑year PFS 0.341 (0.231, 0.502) 0.332 (0.194, 0.569) ---- 0.392 (0.267, 0.575) 0.138 (0.026, 0.733) 0.530 (0.339, 0.826) 0.571 (0.301, 1000) 0.177 (0.061, 0.515) 0.111 (0.017, 0.705) 0.530 (0.335, 0.839) 0.267 (0.153, 0.464) 0.397 (0.389, 0.683) 0.276 (0.369, 0.398) 0.257 (0.209, 0.474) 0.404 (0.450, 0.809) 0.186 (0.078, 0.445) 0.186 (0.078, 0.445) 0.333 (0.189, 0.589) 0.389 (0.218, 0.694)
3‑year PFS 0.398 (0.288, 0.549) 0.427 (0.283, 0.643) 0.367 (0.220, 0.611) 0.428 (0.304, 0.602) 0.277 (0.110, 0.699) 0.605 (0.422, 0.867) 0.571 (0.301, 1.000) 0.265 (0.131, 0.539) 0.111 (0.017, 0.705) 0.530 (0.335, 0.839) 0.343 (0.153, 0.464) 0.487 (0.436, 0.818) 0.301 (0.113, 0.432) 0.341 (0.064, 0.459) 0.464 (0.450, 0.809) 0.310 (0.189, 0.509) 0.310 (0.189, 0.509) 0.333 (0.189, 0.589) 0.389 (0.218, 0.694)
P‑value 0.527 0.178 0.011 0.113 0.029 0.023 0.434 0.687
Median PFS 95% CI 22.0 (14.0, 68.0) 19.0 (9.0, NR) 22.0 (14.0, NR) 26.0 (14.0, NR) 15.0 (6.0, NR) 68.0 (26.0, NR) NR (10.0, NR) 14.5 (9.0, NR) 8.0 (6.0, NR) NR (10.0, NR) 20.0 (10.0, 48.0) 48.0 (26.0, NR) 18.0 (9.0, 22.0) 15.0 (9.0, 22.0) 33.0 (29.0, NR) 26.0 (11.0, 41.0) 14.0 (7.0, 28.0) 48.0 (10.0, NR) 20.0 (9.0, NR)
Cases 60 32 28 47 13 22 7 22 9 18 42 29 31 21 32 27 33 15 27 PFS: Progression-free survival; OS: Overall survival; NR: Not reached
Median age (years) Tumor size (cm) Lymph node involvement Pelvic or PALN Number of chemotherapy cycles Pelvic irradiation Extended-field irradiation PD-L1 expression
Factors Total ≤50 >50 Histology Pure Mixed FIGO stage I+II IIIA+B IIIC1 IIIC2 ≤4 >4 No 1 – 3 4 – 6 EBRT Positive Negative
DOI: http://dx.doi.org/10.18053/jctres.09.202304.23-00067