
Page 84 - JCTR-9-4
P. 84
300 Ali et al. | Journal of Clinical and Translational Research 2023; 9(4): 297-307
P-values 0.30 <0.001 <0.001 <0.001 <0.001 <0.001 0.052 0.001 <0.001 <0.001 0.016
2019 70210 46.6±0.86 5.17±0.06 55138±1600 22335 (32%) 18310 (26%) 15350 (22%) 10995 (16%) 3220 (5%) 33660 (48%) 36340 (52%) 53255 (77%) 9035 (13%) 5395 (8 %) 1070 (2%) 45640 (65%) 13290 (19%) 5325 (8%) 5955 (8%) 4335 (6%) 10749 (15%) 55125 (79%) 18565 (27%) 11925 (18%) 33270 (49%) 3815 (6%) 230 (0.32%)
2018 68939 46.2±0.17 5.16±0.06 51201±1303 22615 (33%) 17864 (26%) 15260 (22%) 10019 (15%) 3180 (5%) 32665 (47%) 36269 (53%) 51439 (77%) 8725 (13%) 5880 (9%) 1145 (2%) 45309 (66%) 13175 (19%) 5260 (8%) 5195 (8%) 4109 (6%) 12275 (18%) 52554 (76%) 17679 (27%) 12235 (18%) 32754 (49%) 3590 (5%) 235 (0.34%)
2017 67364 45.7±0.29 5.18±0.06 47989±1155 22594 (34%) 18065 (27%) 14830 (22%) 8789 (13%) 3085 (5%) 32754 (49%) 34610 (51%) 49864 (77%) 8615 (13%) 5420 (8 %) 1010 (2%) 45819 (68%) 12215 (18%) 4475 (7%) 4855 (7%) 4369 (6%) 13379 (20%) 49614 (74%) 16589 (26%) 11744 (18%) 32890 (51%) 3685 (6%) 255 (0.37%)
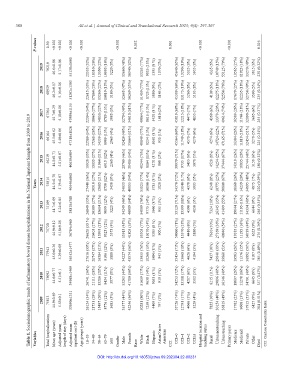
Table 1. Sociodemographic trends of inflammatory bowel disease hospitalizations in the National Inpatient Sample from 2009 to 2019
2016 66164 45.5±0.62 5.40±0.06 47318±1126 22589 (34%) 17360 (26%) 14339 (22%) 8909 (13%) 2965 (4%) 32429 (49%) 33664 (51%) 48849 (77%) 8234 (13%) 5050 (8 %) 930 (1%) 45564 (69%) 11749 (18%) 4570 (7%) 4279 (6%) 4274 (6%) 14724 (22%) 47165 (71%) 16384 (26%) 11819 (18%) 32454 (51%) 3270 (5%) 225 (0.34%)
2015 56219 44.8±0.71 5.01±0.07 40639±904 19920 (35%) 15055 (27%) 11964 (21%) 6915 (12%) 2365 (4%) 25709 (46%) 30485 (54%) 40244 (75%) 8104 (15%) 4270 (8 %) 900 (2%) 39979 (71%) 9735 (17%) 3435 (6%) 3070 (5%) 4520 (8%) 14254 (25%) 37444 (67%) 14310 (26%) 10835 (20%) 25744 (48%) 3150 (6%) 180 (0.32%)
Years 2014 75815 44.5±0.78 5.19±0.07 40546±868 27440 (36%) 20510 (27%) 15685 (21%) 8750 (12%) 3430 (5%) 34935 (46%) 40855 (54%) 55025 (77%) 10000 (14%) 5785 (8 %) 1020 (2%) 54370 (72%) 13140 (17%) 4370 (6%) 3935 (5%) 6240 (8%) 18775 (25%) 50800 (67%) 18660 (26%) 14239 (20%) 34895 (48%) 4875 (7%) 220 (0.29%)
2013 75169 44.7±0.69 5.24±0.05 38810±788 26849 (35%) 20389 (27%) 15604 (21%) 9099 (12%) 3225 (4%) 34249 (46%) 40909 (54%) 54099 (76%) 9775 (14%) 5960 (8 %) 955 (1%) 53129 (71%) 13399 (18%) 4590 (6%) 4050 (5%) 7324 (10%) 26345 (35%) 41499 (55%) 19044 (27%) 11195 (16%) 34334 (48%) 6644 (9%) 265 (0.35%)
2012 75720 44.9±0.12 5.18±0.06 36784±960 26620 (35 %) 20405 (27%) 15995 (21%) 9325 (12%) 3375 (4%) 33915 (45%) 41805 (55%) 55305 (77%) 10170 (14%) 5385 (8 %) 900 (1%) 54060 (71%) 13370 (18%) 4410 (6%) 3880 (5%) 7610 (10%) 27169 (36%) 40940 (54%) 19185 (27%) 11195 (16%) 34739 (48%) 6525 (9%) 275 (0.36%)
2011 77943 45.0±0.36 5.29±0.08 36352±1477 27616 (35%) 20747 (27%) 16584 (21%) 9106 (12%) 3888 (5%) 34227 (44%) 43574 (56%) 53655 (76%) 10268 (15%) 5496 (8 %) 943 (1%) 55454 (71%) 13668 (18%) 4626 (6%) 4194 (5%) 7437 (10%) 29840 (39%) 39860 (53%) 19503 (26%) 11376 (15%) 36892 (50%) 6107 (8%) 385 (0.49%)
2010 75092 44.6±0.77 5.51±0.1 34998±1469 26741 (36%) 21111 (28%) 15206 (20%) 8454 (11%) 3577 (5%) 33263 (44%) 41700 (56%) 51659 (77%) 9638 (14%) 5053 (8 %) 919 (1%) 54253 (72%) 13108 (17%) 4217 (6%) 3512 (5%) 8215 (11%) 29896 (40%) 36146 (49%) 18097 (26%) 11278 (16%) 34791 (49%) 6645 (9%) 357 (0.47%)
2009 75813 44.9±0.69 5.53±0.1 33090±1331 26124 (34%) 21731 (29%) 15497 (20%) 8776 (12%) 3683 (5%) 33377 (44%) 42246 (56%) 50281 (80%) 7259 (12%) 4409 (7%) 797 (1%) 55726 (74%) 12791 (17%) 4066 (5%) 3229 (4%) 7855 (10%) 30154 (40%) 36819 (49%) 17782 (25%) 9608 (13%) 37915 (53%) 6427 (9%) 384 (0.51%)
Total hospitalizations Mean age (years) length of stay (days) inpatient cost ($) Age groups (years) Asian/Native Hospital location and Urban nonteaching Urban teaching CCI: Charlson Comorbidity Index
Variables Adjusted mean Adjusted mean 18–33 34–49 50–64 65–79 ≥80 Gender Male Female Race White Black Hispanic American CCI CCI=0 CCI=1 CCI=2 CCI≥3 teaching status Rural Primary payer Medicare Medicaid Private Other Died
DOI: http://dx.doi.org/10.18053/jctres.09.202304.22-00231