
Page 114 - MI-1-1
P. 114
Microbes & Immunity Comprehensive genomic surveillance analysis of SARS-CoV-2
daily submission rates of SARS-CoV-2 genomes for America, Oceania, and South America were 119 (median:
each continent, categorized according to various VOCs/ 66; 95% CI: 4 – 382), 80 (median: 56; 95% CI: 3 – 244), 30
VOIs, are detailed in Figure S1. The Alpha, Beta, Gamma, (median: 15; 95% CI: 3 – 113), 67 (median: 29; 95% CI: 3 –
Delta, Omicron, Epsilon, Iota, and Other genomes were 284), 52 (median: 28; 95% CI: 1 – 188), and 99 (median: 58;
mainly distributed throughout Europe (641,985/924,692; 95% CI: 1 – 336), respectively (Figure S2A). A comparison
69.43%), Europe (13,076/26,118; 50.07%), South America of submission lag times for the different VOCs/VOIs also
(53,829/92,904; 57.94%), Europe (1,691,805/3,139,228; showed significant differences in the means (p<0.0001).
53.89%), Europe (324,571/462,017; 70.25%), North Notably, the mean submission lag times for Alpha, Beta,
America (45,887/46,290; 99.13%), North America Gamma, Delta, Omicron, Epsilon, Iota, and Others were
(23,581/24,238; 97.29%), and Europe (347,473/814,751; 43 (median: 22; 95% CI: 2 – 151), 72 (median: 43; 95% CI:
42.65%), respectively. These findings suggest that there 1 – 223), 87 (median: 57; 95% CI: 4 – 258), 32 (median:
may be considerable geographic variation among VOCs/ 19; 95% CI: 1 – 109), 24 (median: 15; 95% CI: 3 – 76), 116
VOIs on a continental level, notably with VOIs Epsilon and (median: 55; 95% CI: 1 – 423), 43 (median: 21; 95% CI: 4
Iota.
– 178), and 126 (median: 59; 95% CI: 3 – 483), respectively
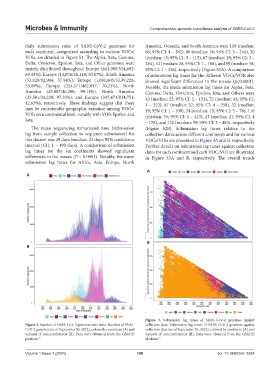
The mean sequencing turnaround time (submission (Figure S2B). Submission lag times relative to the
lag from sample collection to sequence submission) for collection dates across different continents and for various
this dataset was 49 days (median: 22 days; 95% confidence VOCs/VOIs are presented in Figure 3A and B, respectively.
interval [CI]: 1 – 199 days). A comparison of submission Further details on submission lag times against collection
lag times for the six continents showed significant dates for each continent and each VOC/VOI are illustrated
differences in the means (P < 0.0001). Notably, the mean in Figure S3A and B, respectively. The overall trends
submission lag times for Africa, Asia, Europe, North
A
A
B
B
Figure 3. Submission lag times of SARS-CoV-2 genomes against
Figure 2. Number of SARS-CoV-2 genomes over time. Number of SARS- collection date. Submission lag times of SARS-CoV-2 genomes against
CoV-2 genomes (as of September 30, 2022), colored by continent (A) and collection date (as of September 30, 2022), colored by continent (A) and
variants of concern/interest (B). Data were obtained from the GISAID variants of concern/interest (B). Data were obtained from the GISAID
platform. 5 platform. 5
Volume 1 Issue 1 (2024) 108 doi: 10.36922/mi.2294