
Page 117 - MI-2-2
P. 117
Microbes & Immunity Physiological and cognitive effects of PASC
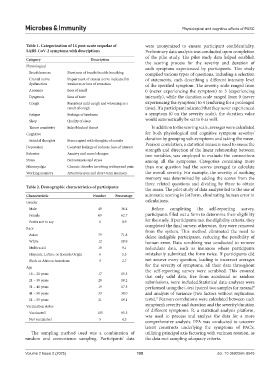
Table 1. Categorization of 14 post‑acute sequelae of were anonymized to ensure participant confidentiality.
SARS‑CoV‑2 symptoms with descriptions Preliminary data analysis was conducted upon completion
of the pilot study. The pilot study data helped establish
Category Description the scoring process for the severity and duration of
Physiological each symptom experienced by participants. This study
Breathlessness Shortness of breath/trouble breathing compiled various types of questions, including a selection
Cranial nerve Impairment of cranial nerve indicated by of statements, each describing a different intensity level
dysfunction weakness or loss of sensation of the specified symptom. The severity scale ranged from
Anosmia Loss of smell 0 (never experiencing the symptom) to 3 (experiencing
Dysgeusia Loss of taste intensely), while the duration scale ranged from 0 (never
Cough Persistent mild cough and wheezing as a experiencing the symptom) to 4 (enduring for a prolonged
result of cough time). If a participant indicated that they never experienced
Fatigue Feelings of tiredness a symptom (0 on the severity scale), the duration value
Sleep Quality of sleep would automatically be set to 0 as well.
Throat sensitivity Itchy/blocked throat In addition to the scoring scale, averages were calculated
Cognitive for both physiological and cognitive symptom severity/
Suicidal thoughts Preoccupied with thoughts of suicide duration by grouping sub-symptoms and taking the mean.
Depression Constant feelings of sadness, loss of interest Pearson correlation, a statistical measure used to assess the
strength and direction of the linear relationship between
Behavior Anxiety and mood changes two variables, was employed to evaluate the connections
Stress Nervousness and stress among all the symptoms. Categories containing more
Fibromyalgia Chronic disorder involving widespread pain than one question had the scores averaged to calculate
Working memory Attention span and short-term memory the overall severity. For example, the severity of working
memory was determined by adding the scores from the
three related questions and dividing by three to obtain
Table 2. Demographic characteristics of participants
the mean. The pilot study of data analysis led to the use of
Characteristic Number Percentage automatic scoring in JotForm, eliminating human error in
Gender calculations.
Male 40 36.4 Before completing the self-reporting survey,
Female 69 62.7 participants filled out a form to determine their eligibility
Prefer not to say 1 0.9 for the study. If participants met the eligibility criteria, they
Race completed the final survey; otherwise, they were removed
from the system. This method eliminated the need to
Asian 79 71.8 delete ineligible participants, reducing the possibility of
White 12 10.9 human error. Data scrubbing was conducted to remove
Multiracial 10 9.1 redundant data, such as instances where participants
Hispanic, Latino, or Spanish Origin 6 5.5 mistakenly submitted the form twice. If participants did
Black or African American 3 2.7 not answer every question, leading to incorrect averages
Age for the severity of symptoms, all their data throughout
18 – 20 years 17 15.5 the self-reporting survey were scrubbed. This ensured
that only valid data, free from accidental or random
21 – 30 years 20 18.2 submissions, were included.Statistical data analyses were
31 – 40 years 19 17.3 performed using the t-test (paired two samples for means)
8
41 – 50 years 33 30.0 and analysis of variance (two factors without replication
9
51 – 55 years 21 19.1 tests). Pearson correlations were calculated between each
Vaccination status symptom’s severity and duration and the severity/duration
Vaccinated 105 95.5 of different symptoms. R, a statistical analysis platform,
was used to process and analyze the data for a more
Not vaccinated 5 4.5
comprehensive analysis. EFA was conducted to uncover
latent constructs underlying the symptoms of PACS,
The sampling method used was a combination of utilizing principal axis factoring with varimax rotation, as
random and convenience sampling. Participants’ data the data met sampling adequacy criteria.
Volume 2 Issue 2 (2025) 109 doi: 10.36922/mi.8545