
Page 68 - MI-2-2
P. 68
Microbes & Immunity Phylogenetic analysis of HPV16 L1 in Asia
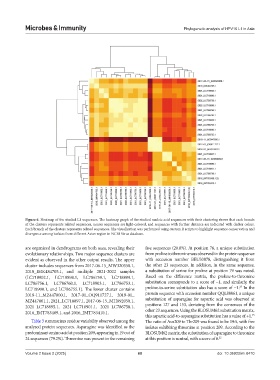
Figure 6. Heatmap of the studied L1 sequences. The heatmap graph of the studied nucleic acid sequences with their clustering shows that each branch
of the clusters represents related sequences, nearer sequences are light-colored, and sequences with further distance are indicated with darker colors.
Each branch of the clusters represents related sequences. The visualization was performed using custom R scripts to highlight sequence conservation and
divergence among isolates from different Asian region in NCBI Virus database.
are organized in dendrograms on both axes, revealing their five sequences (20.8%). At position 76, a unique substitution
evolutionary relationships. Two major sequence clusters are from proline to threonine was observed in the protein sequence
evident as observed in the other output results. The upper with accession number BEU33878, distinguishing it from
cluster includes sequences from 2017-06-15_MW320358.1, the other 23 sequences. In addition, in the same sequence,
2018_IMK484705.1, and multiple 2021-2022 samples a substitution of serine for proline at position 79 was noted.
(LC718902.1, LC718898.1, LC786759.1, LC718899.1, Based on the difference matrix, the proline-to-threonine
LC786756.1, LC786760.1, LC718903.1, LC786753.1, substitution corresponds to a score of −1, and similarly, the
25
LC718900.1, and LC786755.1). The lower cluster contains proline-to-serine substitution also has a score of −1. In the
2018-11_MZ447800.1, 2017-01_OQ911727.1, 2019-01_ protein sequence with accession number QQL88061, a unique
MZ447801.1, 2021_LC718897.1, 2017-06-15_MH892050.1, substitution of asparagine for aspartic acid was observed at
2021_LC718895.1, 2021_LC718901.1, 2021_LC786758.1, positions 127 and 153, deviating from the consensus of the
2016_IMT783409.1, and 2016_IMT783410.1. other 23 sequences. Using the BLOSUM62 substitution matrix,
this aspartic acid-to-asparagine substitution has a value of +1.
25
Table 3 summarizes residue variability observed among the The ratio of Asn209 to Thr209 was found to be 19:5, with five
analyzed protein sequences. Asparagine was identified as the isolates exhibiting threonine at position 209. According to the
predominant amino acid at position 209, appearing in 19 out of BLOSUM62 matrix, the substitution of asparagine to threonine
24 sequences (79.2%). Threonine was present in the remaining at this position is neutral, with a score of 0. 25
Volume 2 Issue 2 (2025) 60 doi: 10.36922/mi.8410