
Page 64 - MI-2-2
P. 64
Microbes & Immunity Phylogenetic analysis of HPV16 L1 in Asia
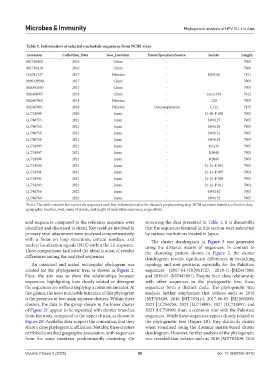
Table 1. Information of selected nucleotide sequences from NCBI virus
Accession Collection_Date Geo_Location Tissue/Specimen/Source Isolate Length
MT783409 2016 China - 7908
MT783410 2016 China - 7906
OQ911727 2017 Pakistan - HNC49 7171
MW320358 2017 China - 7909
MH892050 2017 China - 7905
MK484705 2018 China - xuca1916 7912
MZ447800 2018 Pakistan - C50 7909
MZ447801 2019 Pakistan Oronasopharynx C122 7155
LC718899 2020 Japan - 21-20-P-002 7905
LC786753 2021 Japan - SW0127 7905
LC786755 2021 Japan - SW0129 7905
LC786756 2021 Japan - SW0131 7905
LC786758 2021 Japan - SW0138 7909
LC718895 2021 Japan - K3131 7905
LC718897 2021 Japan - K5048 7905
LC718898 2021 Japan - K5060 7909
LC718900 2021 Japan - 21-21-P-001 7905
LC718901 2021 Japan - 21-21-P-007 7904
LC718902 2021 Japan - 21-21-P-008 7905
LC718903 2021 Japan - 21-21-P-011 7904
LC786759 2022 Japan - SW0142 7905
LC786760 2022 Japan - SW0152 7905
Notes: The table contains the nucleotide sequences and their information after the dataset’s preprocessing step: NCBI accession number, collection date,
geographic location, host, name of isolate, and length of nucleotide sequences, respectively.
acid sequences compared to the reference sequence were reviewing the data presented in Table 1, it is discernible
identified and discussed in detail. Key residues involved in that the sequences featured in this section were submitted
primary viral attachment were analyzed comprehensively, by various institutions located in Japan.
with a focus on loop structures, critical residues, and The cluster dendrogram in Figure 3 was generated
nuclear localization signals (NLS) within the L1 sequence. using the distance matrix of sequences. In contrast to
These comparisons facilitated the identification of residue the clustering pattern shown in Figure 2, the cluster
differences among the analyzed sequences. dendrogram reveals significant differences in branching
An unrooted and scaled rectangular phylogram was topology and root positions, especially for the Pakistani
created for the phylogenetic tree, as shown in Figure 2. sequences (2017-01-|OQ911727, 2018-11-|MZ447800,
Here, the aim was to show the relationships between and 2019-01-|MZ447801). Despite their close relationship
sequences, highlighting how closely related or divergent with other sequences in the phylogenetic tree, these
the sequences are without implying a common ancestor. At sequences form a distinct clade. The phylogenetic tree
first glance, the most noticeable inference of this phylogram analysis further emphasizes that isolates such as 2016
is the presence of two main separate clusters. Within these |MT783409, 2016 |MT783410, 2017-06-05 |MH892050,
clusters, the data in the group shown in the lower cluster 2021 |LC786758, 2021 |LC718895, 2021 |LC718897, and
of Figure 2C appear to be separated with shorter branches 2021 |LC718901 share a common root with the Pakistani
from the roots, compared to the upper cluster, as shown in sequences. While these sequences appear closely related in
Figure 2B. Available data support the contention that they the phylogenetic tree (Figure 2B), they distinctly cluster
share a close phylogenetic affiliation. Notably, these clusters when visualized using the distance matrix-based cluster
exhibited a marked geographic association, with sequences dendrogram. However, further analysis of the phylogenetic
from the same countries predominantly clustering. On tree revealed that isolates such as 2016 |MT783409, 2016
Volume 2 Issue 2 (2025) 56 doi: 10.36922/mi.8410