
Page 66 - MI-2-2
P. 66
Microbes & Immunity Phylogenetic analysis of HPV16 L1 in Asia
A B
C
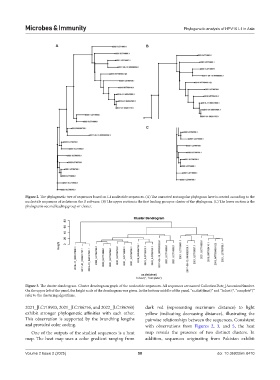
Figure 2. The phylogenetic tree of sequences based on L1 nucleotide sequences. (A) The unrooted rectangular phylogram here is created according to the
nucleotide sequences of isolates on the R software. (B) The upper section is the first leading group or cluster of the phylogram. (C) The lower section is the
phylogram’s second leading group or cluster.
Figure 3. The cluster dendrogram. Cluster dendrogram graph of the nucleotide sequences. All sequences are named CollectionDate_|AccessionNumber.
On the upper left of the panel, the height scale of the dendrogram was given. In the bottom-middle of the panel, “as.dist(dmat)” and “hclust (*, “complete”)”
refer to the clustering algorithms.
2021_|LC718903, 2021_|LC786756, and 2022_|LC786760) dark red (representing maximum distance) to light
exhibit stronger phylogenetic affinities with each other. yellow (indicating decreasing distance), illustrating the
This observation is supported by the branching lengths pairwise relationships between the sequences. Consistent
and provided color coding. with observations from Figures 2, 3, and 5, the heat
One of the outputs of the studied sequences is a heat map reveals the presence of two distinct clusters. In
map. The heat map uses a color gradient ranging from addition, sequences originating from Pakistan exhibit
Volume 2 Issue 2 (2025) 58 doi: 10.36922/mi.8410