
Page 67 - MI-2-2
P. 67
Microbes & Immunity Phylogenetic analysis of HPV16 L1 in Asia
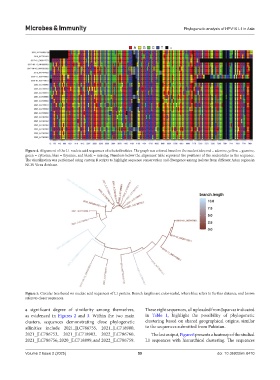
Figure 4. Alignment of the L1 nucleic acid sequences of selected isolates. The graph was colored based on the nucleotides; red = adenine, yellow = guanine,
green = cytosine, blue = thymine, and black = missing. Numbers below the alignment table represent the positions of the nucleotides in the sequence.
The visualization was performed using custom R scripts to highlight sequence conservation and divergence among isolates from different Asian region in
NCBI Virus database.
Figure 5. Circular tree based on nucleic acid sequences of L1 protein. Branch lengths are color-scaled, where blue refers to further distance, and brown
refers to closer sequences.
a significant degree of similarity among themselves, These eight sequences, all uploaded from Japan as indicated
as evidenced in Figures 2 and 3. Within the two main in Table 1, highlight the possibility of phylogenetic
clusters, sequences demonstrating close phylogenetic clustering based on shared geographical origins, similar
affinities include 2021_|LC786755, 2021_|LC718900, to the sequences submitted from Pakistan.
2021_|LC786753, 2021_|LC718903, 2022_|LC786760, The last output, Figure 6 presents a heatmap of the studied
2021_|LC786756, 2020_|LC718899, and 2022_|LC786759. L1 sequences with hierarchical clustering. The sequences
Volume 2 Issue 2 (2025) 59 doi: 10.36922/mi.8410