
Page 122 - MI-2-4
P. 122
Microbes & Immunity Isolation and identification of PEDV strain CHN-CQ-2021
2.10. Histological and immunohistochemical
analysis
Tissue samples collected from piglets were subjected to A B
histopathological and immunohistochemical analyses as
previously described, with some modifications. Briefly,
22
samples were fixed in 4% paraformaldehyde for over 36 h,
dehydrated through a graded ethanol series, embedded
in paraffin, sectioned, and mounted on glass slides. For
histopathological examination, sections (5 μm) were
dewaxed, rehydrated, and stained with hematoxylin and
eosin for observation under a conventional light microscope. C
For immunohistochemical analysis, sections were blocked D
with 1% BSA and incubated with a diluted PEDV-specific
mouse antiserum (1:100; M100048, Zoonogen, China) at
4℃ for 12 h. After washing, the sections were incubated
in a diluted peroxidase-labeled goat anti-mouse IgG
secondary antibody (1:200; SA00001-1, Proteintech, USA)
at room temperature for 50 min. Finally, the sections were
treated with 3,3’-diaminobenzidine chromogen kit (K3468,
Dako, Denmark) and counterstained with hematoxylin.
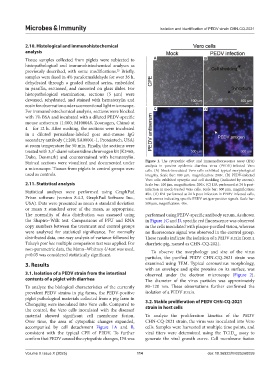
Stained sections were visualized and documented under Figure 1. The cytopathic effect and immunofluorescence assay (IFA)
a microscope. Tissues from piglets in control groups were analysis in porcine epidemic diarrhea virus (PEDV)-infected Vero
cells. (A) Mock-inoculated Vero cells exhibited typical morphological
used as controls. integrity. Scale bar: 100 μm, magnification: 200×. (B) PEDV-infected
Vero cells exhibited syncytia and cell shedding (indicated by arrows).
2.11. Statistical analysis Scale bar: 100 μm, magnification: 200×. (C) IFA performed at 24 h post-
Statistical analyses were performed using GraphPad infection in mock-treated Vero cells. Scale bar: 500 μm, magnification:
40×. (D) IFA performed at 24 h post-infection in PEDV-infected cells,
Prism software (version 8.4.3, GraphPad Software Inc., with arrows indicating specific PEDV antigen-positive signals. Scale bar:
USA). Data were presented as mean ± standard deviation 500 μm, magnification: 40×.
or mean ± standard error of the mean, as appropriate.
The normality of data distribution was assessed using performed using PEDV-specific antibody serum. As shown
the Shapiro–Wilk test. Comparisons of PFU and RNA in Figure 1C and D, specific red fluorescence was observed
copy numbers between the treatment and control groups in the cells inoculated with plaque-purified virion, whereas
were analyzed for statistical significance. For normally no fluorescence signal was observed in the control group.
distributed data, one-way analysis of variance followed by These results indicate the isolation of a PEDV strain from a
Tukey’s post hoc multiple comparison test was applied. For diarrheic pig, named as CHN-CQ-2021.
non-parametric data, the Mann–Whitney U-test was used. To observe the morphology and size of the virus
p<0.05 was considered statistically significant.
particles, the purified PEDV CHN-CQ-2021 strain was
3. Results examined using TEM. Typical coronavirus morphology,
with an envelope and spike proteins on its surface, was
3.1. Isolation of a PEDV strain from the intestinal observed under the electron microscope (Figure 2).
contents of a piglet with diarrhea The diameter of the virus particles was approximately
To analyze the biological characteristics of the currently 80–120 nm. These observations further confirmed the
prevalent PEDV strains in pig farms, the PEDV-positive isolation of a PEDV strain.
piglet pathological materials collected from a pig farm in 3.2. Stable proliferation of PEDV CHN-CQ-2021
Chongqing were inoculated into Vero cells. Compared to
the control, the Vero cells inoculated with the diseased strain in host cells
material showed significant cell membrane fusion. To analyze the proliferation kinetics of the PEDV
Over time, the area of cytopathic changes expanded, CHN-CQ-2021 strain, the virus was inoculated into Vero
accompanied by cell detachment Figure 1A and B, cells. Samples were harvested at multiple time points, and
consistent with the typical CPE of PEDV. To further viral titers were determined using the TCID assay to
50
confirm that PEDV caused the cytopathic changes, IFA was generate the viral growth curve. Cell membrane fusion
Volume X Issue X (2025) 114 doi: 10.36922/MI025260059