
Page 28 - MSAM-1-2
P. 28
Materials Science in Additive Manufacturing Laser absorption and printability of 90W-Ni-Fe
with obtaining the best LPBF printability. Meanwhile, a where ∆P is the capillary pressure, D is the grain radius,
G
good agreement is obtained between the simulated and ε is the liquid thickness, and n is the viscosity of the liquid.
d
experimental results. The optimized 90W-Ni-Fe powder formed a homogeneous
powder bed, making the solidification shrinkage rate at
3.3. Mechanical properties of the optimal 90W-Ni-Fe different positions similar. Hence, the residual stress was
alloys uniformly distributed in the specimen and the gradient of
The above analysis shows that optimal specimens can residual stress was small.
be obtained by homogeneous nanoparticle-coated The residual stress generated by the heating-cooling
90W-Ni-Fe powder with high sphericity. The density of thermal cycle of the LPBF processing is one of the key
LPBF-fabricated specimens has an important influence on factors affecting the properties of fabricated parts. It
their microhardness and residual stress distribution [25,35] . has been reported that LPBF-processed specimens
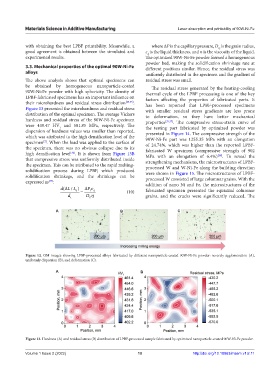
Figure 13 presented the microhardness and residual stress with smaller residual stress gradients are less prone
distribution of the optimal specimen. The average Vickers to deformation, so they have better mechanical
hardness and residual stress of the 90W-Ni-Fe specimen properties [35,37] . The compressive stress-strain curve of
were 439.47 HV and 501.85 MPa, respectively. The the testing part fabricated by optimized powder was
1
dispersion of hardness values was smaller than reported, presented in Figure 14. The compressive strength of the
which was attributed to the high densification level of the 90W-Ni-Fe part was 1255.35 MPa with an elongation
specimen . When the load was applied to the surface of of 24.74%, which was higher than the reported LPBF-
[2]
the specimen, there was no obvious collapse due to its fabricated W specimen (compressive strength of 902
high densification level . It is shown from Figure 13B MPa with an elongation of 6.4%) . To reveal the
[36]
[38]
that compressive stress was uniformly distributed inside strengthening mechanisms, the microstructures of LPBF-
the specimen. This can be attributed to the rapid melting- processed W and W-Ni-Fe along the building direction
solidification process during LPBF, which produced were shown in Figure 15. The microstructures of LPBF-
solidification shrinkage, and the shrinkage can be processed W consisted of large columnar grains. With the
expressed as : addition of nano Ni and Fe, the microstructures of the
[37]
dL L( / 0 ) P d (10) fabricated specimen presented the equiaxial columnar
f
d t D grains, and the cracks were significantly reduced. The
G
A B C
Figure 12. OM images showing LPBF-processed alloys fabricated by different nanoparticle-coated 90W-Ni-Fe powder: severely agglomeration (A),
uniformly dispersion (B), and deformation (C).
A B
Figure 13. Hardness (A) and residual stress (B) distribution of LPBF-processed sample fabricated by optimized nanoparticle-coated 90W-Ni-Fe powder.
Volume 1 Issue 2 (2022) 10 http://doi.org/10.18063/msam.v1i2.11