
Page 53 - MSAM-1-2
P. 53
Materials Science in Additive Manufacturing Process study of DED steel matrix composites
improves the distribution of Si N and AlN in Al6061 and determine the optimum process conditions for powder
4
3
aluminum powder. While the process also decreases the mixing.
reinforcement particle size, it improved the composite The effect of each variable on the density of the DED
characteristics by eliminating the reinforcement particle samples is shown in Figure 8. Table 6 shows the ranks and
defects. Furthermore, the mechanical alloying also deltas of the S/N ratios. The delta is the difference between
improved the matrix characteristics due to deformation the highest and lowest average response for each variable.
and dislocations . During mechanical alloying, it is
[28]
possible for the morphology of powders to change from It was found that the variation of density was not
spherical to flattened and finally to nearly spherical significant across the various parameters and that the
again . It was also observed that while the particle size of effect of each of the variable was negligible on the density
[29]
the mixed powder decreases with increase in milling time, of the DED 316/TiB MMC. The spread of mean density
2
there is a limit after which, the particle size will remain across the DED samples was <0.5% and the delta is <0.1
stable due to equilibrium between the cold welding and for all three variables. However, the DED samples were
repeated fracture [30-32] . Hence, it is important to investigate still denser compared to same material produced using
sintering and L-PBF . Furthermore, no visible pore or
[33]
crack was observed in the samples.
3.3. Microhardness
The mean and S/N ratio of the measured Vickers hardness
of the DED samples are shown in Table 7. The mean
microhardness varied between 168.5 HV and 186.4
HV, which is similar to pure 316L samples produced by
DED .
[34]
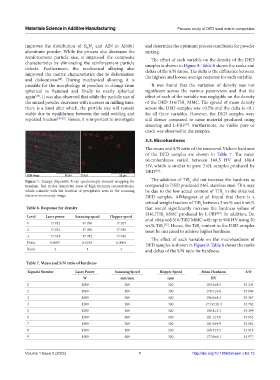
Figure 7. Energy dispersive X-ray spectroscopy element mapping for The addition of TiB did not increase the hardness as
2
titanium. Red circles demarcate areas of high titanium concentrations, compared to DED produced 316L stainless steel. This may
which coincide with the location of precipitates seen in the scanning be due to the low actual content of TiB in the obtained
2
electron microscopy image. DED samples. AlMangour et al. found that there is a
critical weight fraction of TiB between 3 wt.% and 6 wt.%
2
Table 6. Response for density that would significantly increase the hardness values of
316L/TiB MMC produced by L-PBF . In addition, Du
[33]
Level Laser power Scanning speed Hopper speed et al. obtained 316/TiB2 MMC with up to 900 HV using 20
2
1 17.932 17.936 17.927 wt.% TiB [15] . Hence, the TiB content in the DED samples
2
2
2 17.922 17.930 17.926 must be increased to achieve higher hardness.
3 17.924 17.912 17.926 The effect of each variable on the microhardness of
Delta 0.0097 0.0235 0.0009 DED samples is shown in Figure 9. Table 8 shows the ranks
Rank 2 1 3 and deltas of the S/N ratio for hardness.
Table 7. Mean and S/N ratio of hardness
Taguchi Number Laser Power Scanning Speed Hopper Speed Mean Hardness S/N
W mm/min rpm HV
1 1000 200 200 183.5±8.5 45.244
2 1000 400 300 178.7±9.8 45.006
3 1000 600 400 186.0±8.4 45.367
4 1200 200 300 173.9±10.4 44.762
5 1200 400 400 186.4±5.1 45.399
6 1200 600 200 181.1±5.0 45.151
7 1400 200 400 181.9±9.9 45.161
8 1400 400 200 168.5±5.5 44.519
9 1400 600 300 177.6±6.1 44.977
Volume 1 Issue 2 (2022) 7 http://doi.org/10.18063/msam.v1i2.13