
Page 49 - MSAM-1-2
P. 49
Materials Science in Additive Manufacturing Process study of DED steel matrix composites
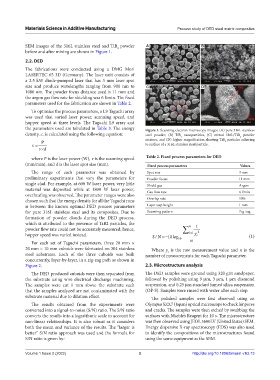
SEM images of the 316L stainless steel and TiB powder A B
2
before and after mixing are shown in Figure 1.
2.2. DED
The fabrications were conducted using a DMG Mori
LASERTEC 65 3D (Germany). The laser unit consists of
a 2.5 kW diode-pumped laser that has 3 mm laser spot
size and produce wavelengths ranging from 900 nm to C D
1080 nm. The powder focus distance used is 11 mm and
the argon gas flow rate for shielding was 6 l/min. The fixed
parameters used for the fabrication are shown in Table 2.
To optimize the process parameters, a L9 Taguchi array
was used that varied laser power, scanning speed, and
hopper speed at three levels. The Taguchi L9 array and
the parameters used are tabulated in Table 3. The energy Figure 1. Scanning electron microscopy images: (A) pure 316L stainless
density, ε, is calculated using the following equation: steel powder, (B) TiB nanoparticles, (C) mixed 316L/TiB powder
2
2
mixture, and (D) higher magnification showing TiB particles adhering
Ρ 2
ε= to surface of a 316L stainless steel particle.
v d
×
where P is the laser power (W), v is the scanning speed Table 2. Fixed process parameters for DED
(mm/min), and d is the laser spot size (mm). Fixed process parameters Values
The range of each parameter was obtained by Spot size 3 mm
preliminary experiments that vary the parameters for Powder focus 11 mm
single clad. For example, at 600 W laser power, very little Shield gas Argon
material was deposited while at 1800 W laser power, Gas flow rate 6 l/min
overheating was observed. The parameter ranges were also
chosen such that the energy density for all the Taguchi runs Overlap rate 50%
is between the known optimal DED process parameters Layer step height 1 mm
for pure 316L stainless steel and its composites. Due to Scanning pattern Zig-zag
formation of powder clouds during the DED process,
which is attributed to the presence of TiB2 particles, the 1
powder flow rate could not be accurately measured; hence, ∑ n
hopper speed was varied instead. / S N =− 10 log = ii y i 2 (1)
For each set of Taguchi parameters, three 20 mm × 10 n
20 mm × 10 mm cuboids were fabricated on 304 stainless Where y is the raw measurement value and n is the
i
steel substrates. Each of the three cuboids was built number of measurements for each Taguchi parameter.
concurrently, layer-by-layer, in a zig-zag path as shown in
Figure 2. 2.3. Microstructure analysis
The DED produced cuboids were then separated from The DED samples were ground using 320 grit sandpaper,
the substrate using wire electrical discharge machining. followed by polishing using 9 µm, 3 µm, 1 µm diamond
The samples were cut 1 mm above the substrate such suspension, and 0.25 µm standard fumed silica suspension
that the samples analyzed are not contaminated with the (OP-S). Samples were rinsed with water after each step.
substrate material due to dilution effect. The polished samples were first observed using an
The results obtained from the experiments were Olympus SZX7 (Japan) optical microscope to check for pores
converted into a signal-to-noise (S/N) ratio. The S/N ratio and cracks. The samples were then etched by swabbing the
converts the results into a logarithmic scale to account for surfaces with Marble’s Reagent for 10 s. The microstructure
non-linear relationships. It is also robust as it considers was then observed using JEOL 5600LV (United States) SEM.
both the mean and variance of the results. The “larger is Energy dispersive X-ray spectroscopy (EDS) was also used
better” S/N ratio approach was used and the formula for to identify the compositions of the microstructures found
S/N ratio is given by: using the same equipment as the SEM.
Volume 1 Issue 2 (2022) 3 http://doi.org/10.18063/msam.v1i2.13