
Page 30 - MSAM-2-2
P. 30
Materials Science in Additive Manufacturing Water repellence via pinecone structures
A B C
D E
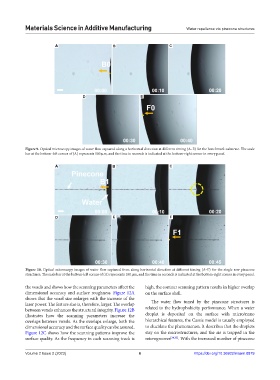
Figure 9. Optical microscopy images of water flow captured along a horizontal direction at different timing (A–E) for the benchmark substrate. The scale
bar at the bottom-left corner of (A) represents 100 μm, and the time in seconds is indicated at the bottom-right corner in every panel.
A B C
D E F
Figure 10. Optical microscopy images of water flow captured from along horizontal direction at different timing (A–F) for the single row pinecone
structures. The scale bar at the bottom-left corner of (A) represents 100 μm, and the time in seconds is indicated at the bottom-right corner in every panel.
the voxels and shows how the scanning parameters affect the high, the contour scanning pattern results in higher overlap
dimensional accuracy and surface roughness. Figure 12A on the surface shell.
shows that the voxel size enlarges with the increase of the The water flow tuned by the pinecone structures is
laser power. The feature size is, therefore, larger. The overlap
between voxels enhances the structural integrity. Figure 12B related to the hydrophobicity performance. When a water
illustrates how the scanning parameters increase the droplet is deposited on the surface with micro/nano
overlaps between voxels. As the overlaps enlarge, both the hierarchical features, the Cassie model is usually employed
dimensional accuracy and the surface quality can be assured. to elucidate the phenomenon. It describes that the droplets
Figure 12C shows how the scanning patterns improve the stay on the microstructures, and the air is trapped in the
surface quality. As the frequency in each scanning track is microgrooves [34,35] . With the increased number of pinecone
Volume 2 Issue 2 (2023) 6 https://doi.org/10.36922/msam.0879