
Page 29 - MSAM-2-2
P. 29
Materials Science in Additive Manufacturing Water repellence via pinecone structures
that the surface roughness is more dependent on the hatch The velocity of water expansion was calculated as 25.0 μm/s
spacing, and a smooth surface was obtained with the from point B0 in Figure 9A to point F0 in Figure 9E. The
scanning strategy UHT-100-100. detailed flow process can be referred to in Videoclip S1.
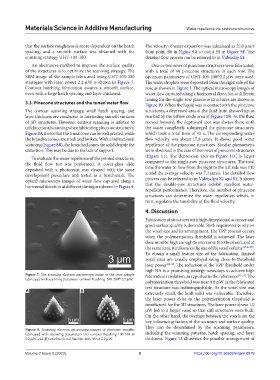
An alternative method to improve the surface quality One or two rows of pinecone structures were fabricated,
of the structures is to optimize the scanning strategy. The with a total of 40 pinecone structures in each row. The
SEM image of the sample fabricated using CHT-200-200 optimum parameters of UHT-100-100 2.2 μW were used.
@
strategies with laser power 2.2 μW is shown in Figure 7. The water droplets were deposited from the right side of the
Contour hatching fabrication assures a smooth surface, row, as shown in Figure 3. The optical microscopy images of
even with a large hatch spacing and layer thickness. water flow captured along a horizontal direction at different
timing for the single row pinecone structures are shown in
3.3. Pinecone structures and the tuned water flow Figure 10. When the liquid was in contact with the pinecone
The contour scanning strategy, small hatch spacing, and structures, a depressed area at the fluid front showed up, as
layer thickness are conducive to fabricating smooth surfaces marked by the yellow circle area of Figure 10B. As the fluid
of 3D structures. However, contour scanning is inferior to moved forward, the depressed area was always there until
unidirectional scanning when fabricating pinecone structures. the water completely submerged the pinecone structures,
Figure 8A shows that the trunk cone can be well printed, while which took a total time of 45 s. The corresponding water
the branched cones are small and broken. With unidirectional flow velocity was about 17.8 μm/s. It shows good water
scanning (Figure 8B), the branched cones are solid despite the repellence of the pinecone structures. Similar phenomena
distortion. This may be due to the lack of support. were observed in the case of two rows of pinecone structures
To evaluate the water repellence of the printed structures, (Figure 11). The depression area in Figure 11C is larger
the fluid flow test was performed. A cover-glass slide compared to the single-row pinecone structures. The total
deposited with a photoresist was cleaned with the same time the water to flow from the right to the left side was 110
development procedure and tested as a benchmark. The s, and the average velocity was 7.2 μm/s. The detailed flow
optical microscopy images of water flow captured along a process can be referred to in Videoclips S2 and S3. It shows
horizontal direction at different timing are shown in Figure 9. that the double-row structures exhibit excellent water-
repellent performance. Therefore, the number of pinecone
structures can determine the water repellence, which, in
turn, regulates the tunability of the fluid velocity.
4. Discussion
Fabrication of structures with high dimensional accuracy and
good surface quality is desirable. Both requirements rely on
the voxel size and its arrangement. The TPP process occurs
when the polymerization threshold is achieved. The laser
dose must be high enough to overcome this threshold, and at
the same time, it influences the size of the voxel volume [17,27,28] .
To obtain a small feature size of the fabrication, limited
voxel sizes are usually employed using close-to-threshold
laser power [29,30] . The reduction of the TPP threshold under
high NA is a promising strategy nowadays to achieve high
Figure 7. The scanning electron microscope image of the cone sample fabrication resolution, as reported in the references [31-33] . The
fabricated with scanning parameter contour hatching-200-200 2.2 μW.
@
polymerization threshold was near 0.8 μW as the fabricated
text structure was indistinguishable. As the voxel size was
A B
extremely small, the built solid was vulnerable. Therefore,
the laser power close to the polymerization threshold is
insufficient for the 3D structures. The laser power above 1.0
μW led to a larger voxel so that stiff structures were built.
On the other hand, the overlaps between the voxels are the
key influencing factors of the accuracy and surface quality.
They can be determined by the scanning parameters,
Figure 8. Scanning electron microscope images of pinecone samples
fabricated with scanning parameters (A) contour hatching-100-100 @ including the scanning patterns, hatch spacing, and layer
2.2 μW and (B) unidirectional hatchin-100-100 @ 2.2 μW. thickness. Figure 12 illustrates the possible arrangement of
Volume 2 Issue 2 (2023) 5 https://doi.org/10.36922/msam.0879