
Page 28 - MSAM-2-2
P. 28
Materials Science in Additive Manufacturing Water repellence via pinecone structures
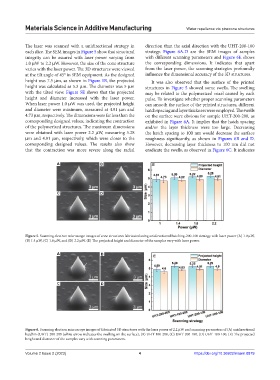
The laser was scanned with a unidirectional strategy in direction than the axial direction with the UHT-200-100
each slice. The SEM images in Figure 5 show that structural strategy. Figure 6A-D are the SEM images of samples
integrity can be assured with laser power varying from with different scanning parameters and Figure 6E shows
1.0 μW to 2.2 μW. However, the size of the cone structure the corresponding dimensions. It indicates that apart
varies with the laser power. The 3D structures were viewed from the laser power, the scanning strategies profoundly
at the tilt angle of 45° in SEM equipment. As the designed influence the dimensional accuracy of the 3D structures.
height was 7.5 μm, as shown in Figure 1B, the projected It was also observed that the surface of the printed
height was calculated as 5.3 μm. The diameter was 5 μm structures in Figure 5 showed some swells. The swelling
with the tilted view. Figure 5E shows that the projected may be related to the polymerized voxel caused by each
height and diameter increased with the laser power. pulse. To investigate whether proper scanning parameters
When laser power 1.0 μW was used, the projected height can smooth the surface of the printed structures, different
and diameter were minimum, measured at 4.91 μm and hatch spacing and layer thickness were employed. The swells
4.73 μm, respectively. The dimensions were far less than the on the surface were obvious for sample UHT-200-200, as
corresponding designed values, indicating the contraction exhibited in Figure 6A. It implies that the hatch spacing
of the polymerized structures. The maximum dimensions and/or the layer thickness were too large. Decreasing
were obtained with laser power 2.2 μW, measuring 5.28 the hatch spacing to 100 nm would decrease the surface
μm and 4.91 μm, respectively, which were closer to the roughness significantly, as shown in Figures 6B and D.
corresponding designed values. The results also show However, decreasing layer thickness to 100 nm did not
that the contraction was more severe along the radial eradicate the swells, as observed in Figure 6C. It indicates
A B E
C D
Figure 5. Scanning electron microscope images of cone structures fabricated using unidirectional hatching-200-100 strategy with laser power (A) 1.0 μW,
(B) 1.4 μW, (C) 1.8 μW, and (D) 2.2 μW. (E) The projected height and diameter of the samples vary with laser power.
A B E
C D
Figure 6. Scanning electron microscope images of fabricated 3D structures with the laser power of 2.2 μW and scanning parameters of (A) unidirectional
hatchin (UHT)-200-200 (white arrow indicates the swelling on the surface), (B) UHT-100-200, (C) UHT-200-100, (D) UHT-100-100. (E) The projected
height and diameter of the samples vary with scanning parameters.
Volume 2 Issue 2 (2023) 4 https://doi.org/10.36922/msam.0879