
Page 39 - MSAM-2-2
P. 39
Materials Science in Additive Manufacturing Tensile and fatigue properties of Ti6Al4V SLM parts
3.3. Fatigue property testing takes an extremely long time to yield enough data
points to generate credible results.
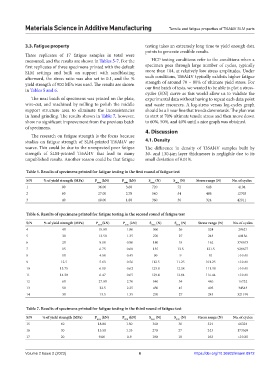
Three replicates of 17 fatigue samples in total were
measured, and the results are shown in Tables 5-7. For the HCF testing conditions refer to the conditions when a
first replicates of three specimens printed with the default specimen goes through large number of cycles, typically
SLM settings and built on support with sandblasting more than 104, at relatively low stress amplitudes. Under
afterward, the stress ratio was also set to 0.1, and the % such conditions, Ti6Al4V typically exhibits higher fatigue
yield strength of 900 MPa was used. The results are shown strength of around 70 – 80% of ultimate yield stress. For
in Tables 5 and 6. our first batch of tests, we wanted to be able to plot a stress-
cycles (S/N) curve as this would allow us to validate the
The next batch of specimens was printed on the plate, experimental data without having to repeat each data point
wire-cut, and machined by milling to polish the middle and waste resources. A log-stress versus log-cycles graph
support structure area to eliminate the inconsistencies should be a linear line that trends downwards. The plan was
in hand grinding. The results shown in Table 7, however, to start at 70% ultimate tensile stress and then move down
show no significant improvement from the previous batch to 60%, 50%, and 40% until a nice graph was obtained.
of specimens. 4. Discussion
The research on fatigue strength is the focus because
studies on fatigue strength of SLM-printed Ti6Al4V are 4.1. Density
scarce. This could be due to the unexpected poor fatigue The difference in density of Ti6Al4V samples built by
strength of SLM-printed Ti6Al4V that lead to many 30- and 130-μm layer thicknesses is negligible due to its
unpublished results. Another reason could be that fatigue small deviation of 0.01%.
Table 5. Results of specimens printed for fatigue testing in the first round of fatigue test
S/N % of yield strength (MPa) P (kN) P (kN) S (N) S (N) Stress range (N) No. of cycles
max min max min
1 80 36.00 3.60 720 72 648 4104
2 60 27.00 2.70 540 54 486 12703
3 40 18.00 1.80 360 36 324 42011
Table 6. Results of specimens printed for fatigue testing in the second round of fatigue test
S/N % of yield strength (MPa) P (kN) P (kN) S (N) S (N) Stress range (N) No. of cycles
max min max min
4 40 18.00 1.80 360 36 324 29621
5 30 13.50 1.35 270 27 243 60136
6 20 9.00 0.90 180 18 162 370673
7 15 6.75 0.68 135 13.5 121.5 929677
8 10 4.50 0.45 90 9 81 >10 M
9 12.5 5.63 0.56 112.5 11.25 101.25 >10 M
10 13.75 6.19 0.62 123.8 12.38 111.38 >10 M
11 14.38 6.47 0.65 129.4 12.94 116.44 >10 M
12 60 27.00 2.70 540 54 486 16732
13 50 22.5 2.25 450 45 405 34543
14 30 13.5 1.35 270 27 243 321199
Table 7. Results of specimens printed for fatigue testing in the third round of fatigue test
S/N % of yield strength (MPa) P (kN) P (kN) S (N) S (N) Stress range (N) No. of cycles
max min max min
15 40 18.00 1.80 360 36 324 66324
16 30 13.50 1.35 270 27 243 173569
17 20 9.00 0.9 180 18 162 >10 M
Volume 2 Issue 2 (2023) 6 https://doi.org/10.36922/msam.0912