
Page 50 - MSAM-2-2
P. 50
Materials Science in Additive Manufacturing Biomimetic structures for optical focusing
at the position of R from the coordinate origin, followed 16 m
by the analysis surface with a size of 6 mm × 5 mm placed 15 KT (II)
at the position of R/2 from the coordinate origin. The B
surface characteristic of the CAD model was set to perfect Where m is the atomic mass, K is the Boltzmann
B
reflection. constant, and γ is the surface tension of the melt. The
3. Results and discussion surface tension of the melt γ could be calculated employing
the following equation :
[35]
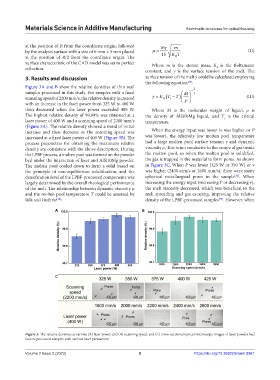
Figure 3A and B show the relative densities of thin wall 2
samples processed in this study. For samples with a fixed M 3
T
scanning speed of 2200 mm/s, the relative density increased K B T c (III)
with an increase in the laser power from 325 W to 400 W,
then decreased when the laser power exceeded 400 W. Where M is the molecular weight of liquid, ρ is
The highest relative density of 99.98% was obtained at a the density of AlSi10Mg liquid, and T is the critical
laser power of 400 W and a scanning speed of 2200 mm/s temperature. c
(Figure 3A). The relative density showed a trend of initial
increase and then decrease as the scanning speed was When the energy input was lower (v was higher or P
increased at a fixed laser power of 400 W (Figure 3B). The was lower), the relatively low molten pool temperature
process parameters for obtaining the maximum relative had a large molten pool surface tension γ and dynamic
density are consistent with the above description. During viscosity μ. This is not conducive to the escape of gas inside
the LPBF process, a molten pool was formed on the powder the molten pool, so when the molten pool is solidified,
bed under the interaction of laser and AlSi10Mg powder. the gas is trapped in the material to form pores. As shown
The molten pool cooled down to form a solid based on in Figure 3C, When P was lower (325 W or 350 W) or v
the principle of non-equilibrium solidification, and the was higher (2400 mm/s or 2600 mm/s), there were many
[36]
densification level of the LPBF-processed components was spherical metallurgical pores in the sample . When
largely determined by the overall rheological performance increasing the energy input (increasing P or decreasing v),
of the melt. The relationship between dynamic viscosity μ the melt viscosity decreased, which was beneficial to the
and the molten pool temperature T could be assessed by melt spreading and gas escaping, improving the relative
Iida and Guthrie : density of the LPBF-processed samples . However, when
[37]
[34]
A B
C
Figure 3. The relative densities at various (A) laser power and (B) scanning speed, and (C) cross-sectional optical microscopy images of laser powder bed
fusion-processed samples with various laser parameters.
Volume 2 Issue 2 (2023) 5 https://doi.org/10.36922/msam.0361