
Page 52 - MSAM-2-2
P. 52
Materials Science in Additive Manufacturing Biomimetic structures for optical focusing
A B C
D E F
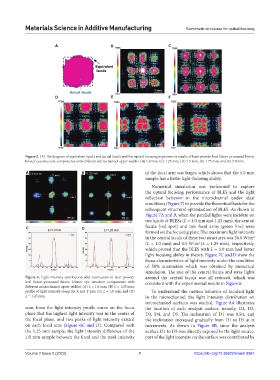
Figure 5. (A) The diagram of equivalent facula and actual facula and the optical focusing experiments results of laser powder bed fusion-processed bionic
lobster eye structure components with different microchannel upper widths: (B) 1.0 mm, (C) 1.25 mm, (D) 1.5 mm, (E) 1.75 mm, and (F) 2.0 mm.
A B of the focal arm was larger, which shows that the 1.0 mm
sample has a better light-focusing ability.
Numerical simulation was performed to explore
the optical focusing performance of BLES and the light
reflection behavior in the microchannel under ideal
conditions (Figure 7) to provide the theoretical basis for the
subsequent structural optimization of BLES. As shown in
Figure 7A and B, when the parallel lights were incident on
two kinds of BLESs (L = 1.0 mm and 1.25 mm), the central
C D facula (red spot) and two focal arms (green line) were
formed on the focusing plate. The maximum light intensity
in the central facula of these two structures was 26.0 W/m
2
(L = 1.0 mm) and 4.5 W/m (L = 1.25 mm), respectively,
2
which proved that the BLES with L = 1.0 mm had better
light-focusing ability in theory. Figure 7C and D show the
focus characteristics of light intensity under the condition
of 50% attenuation which was obtained by numerical
simulation. The size of the central facula and stray lights
Figure 6. Light intensity distribution after attenuation of laser powder around the central facula was all reduced, which was
bed fusion-processed bionic lobster eye structure components with consistent with the experimental results in Figure 6.
different microchannel upper widths: (A) L = 1.0 mm, (B) L = 1.25 mm;
profile of light intensity along the X and Y axis: (C) L = 1.0 mm, and (D) To understand the motion behavior of incident light
L = 1.25 mm. in the microchannel, the light intensity distribution on
microchannel surfaces was studied. Figure 8A illustrates
seen from the light intensity profile curve on the focus the location of each analysis surface, namely, D1, D2,
plane that the highest light intensity was in the center of D3, D4, and D5. The inclination of D1 was 0.5α, and
the focal plane, and two peaks of light intensity existed the inclination increased gradually from D1 to D5 at α
on each focal arm (Figure 6C and D). Compared with increments. As shown in Figure 8B, since the analysis
the 1.25 mm sample, the light intensity difference of the surface D1 to D5 was directly exposed to the light source,
1.0 mm sample between the focal and the peak intensity part of the light intensity on the surface was contributed by
Volume 2 Issue 2 (2023) 7 https://doi.org/10.36922/msam.0361