
Page 53 - MSAM-2-2
P. 53
Materials Science in Additive Manufacturing Biomimetic structures for optical focusing
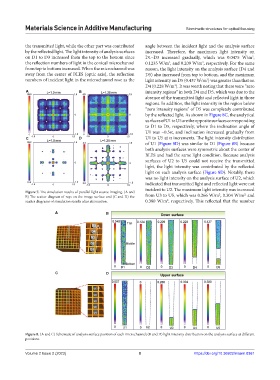
the transmitted light, while the other part was contributed angle between the incident light and the analysis surface
by the reflected light. The light intensity of analysis surfaces increased. Therefore, the maximum light intensity on
on D1 to D3 increased from the top to the bottom since D1–D3 increased gradually, which was 0.0475 W/m ,
2
the reflection numbers of light in the conical microchannel 0.1235 W/m , and 0.209 W/m , respectively. For the same
2
2
from top to bottom increased. When the microchannel was reason, the light intensity on the analysis surface (D4 and
away from the center of BLES (optic axis), the reflection D5) also increased from top to bottom, and the maximum
numbers of incident light in the microchannel rose as the light intensity on D5 (0.437 W/m ) was greater than that on
2
D4 (0.228 W/m ). It was worth noting that there were “zero
2
A B intensity regions” in both D4 and D5, which was due to the
absence of the transmitted light and reflected light in those
regions. In addition, the light intensity in the region below
“zero intensity regions” of D5 was completely contributed
by the reflected light. As shown in Figure 8C, the analytical
surfaces of U1 to U5 are the opposite surfaces corresponding
to D1 to D5, respectively, where the inclination angle of
U1 was −0.5α, and inclination increased gradually from
C D U1 to U5 at α increments. The light intensity distribution
of U1 (Figure 8D) was similar to D1 (Figure 8B) because
both analysis surfaces were symmetric about the center of
BLES and had the same light condition. Because analysis
surfaces of U2 to U5 could not receive the transmitted
light, the light intensity was contributed by the reflected
light on each analysis surface (Figure 8D). Notably, there
was no light intensity on the analysis surface of U2, which
indicated that transmitted light and reflected light were not
incident to U2. The maximum light intensity was increased
Figure 7. The simulation results of parallel light source imaging. (A and 2 2,
B) The scatter diagram of rays on the image surface and (C and D) the from U3 to U5, which was 0.266 W/m , 0.304 W/m and
2
scatter diagrams of simulation results after attenuation. 0.380 W/m , respectively. This reflected that the number
A B
C D
Figure 8. (A and C) Schematic of analysis surface position of each microchannel; (B and D) light intensity distribution on the analysis surface at different
positions.
Volume 2 Issue 2 (2023) 8 https://doi.org/10.36922/msam.0361