
Page 62 - MSAM-2-2
P. 62
Materials Science in Additive Manufacturing Cellulose microfiber in ABS filament for 3D printing
The equipment used in the impact tests was the Izod requires fixing the specimen in a vertical position with
pattern by Tinius Olsen, which is owned by Mackenzie the “V” notch positioned in a guide that guarantees the
Presbyterian University. The test in the Izod pattern fixing precision. The load was applied instantaneously
by releasing a pendular hammer initially launched at a
height “h .” After the release and the impact with the test
0
specimen, the hammer continues its course up to a height
“h ,” which is less than “h .” The energy absorption by the
0
f
test specimen is calculated from the difference between
“h ” and “h .” The impact speed was calibrated at 3.45 m/s.
f
0
The melt flow index test was carried out using a Tinius
Olsen extrusion plastometer at Mackenzie Presbyterian
University. The tests followed the ASTM D1238 standard.
The equipment to evaluate the melt flow index consists of
a heated chamber, where the polymer is placed to melt.
Over the chamber, a standardized piston forces the molten
polymer to flow through a capillary with standardized
dimensions. The polymer melting was performed at 200°C
and a load of 5.0 kg. The melting masses of the samples
Figure 7. Digital model of specimens for flexion test. were collected, and the results were obtained in the unit
of g/10 min.
4. Results
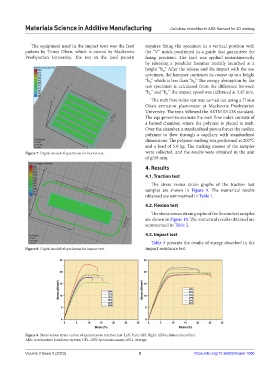
4.1. Traction test
The stress versus strain graphs of the traction test
samples are shown in Figure 9. The numerical results
obtained are summarized in Table 1.
4.2. Flexion test
The stress versus strain graphs of the flexion test samples
are shown in Figure 10. The numerical results obtained are
summarized in Table 2.
4.3. Impact test
Table 3 presents the results of energy absorbed in the
Figure 8. Digital model of specimens for impact test. impact resistance test.
Figure 9. Stress versus strain curves of specimens in traction test. Left: Pure ABS; Right: ABS/cellulose microfiber.
ABS: Acrylonitrile butadiene styrene; CP1–CP5: Specimens name; AVG: Average.
Volume 2 Issue 2 (2023) 5 https://doi.org/10.36922/msam.1000