
Page 103 - MSAM-2-3
P. 103
Materials Science in Additive Manufacturing Validation of a novel ML model for AM-PSP
parameters to minimize the error rate within the training microstructure functions (MP + SEM); and the last design
set through cross-validation. After the training process, integrates all the input features (All = MP + SEM + EBSD +
the testing set was applied to the best XGBoost estimator XRD). The rationale for this approach is to understand the
and linear model to validate the accuracy . Figure 9A individual and interaction effects of machining conditions,
[90]
shows the RMSE results, where all features condition grain size, grain density, grain orientation, and residual
accuracy for the XGBoost model reaches 84.2%. The stress on machining behavior.
second condition in this study combined all L-PBF and The first model run in this study is that all the EB-PBF
DED datasets together, where randomly selected sets of and L-PBF datasets, in total, 14400 sample points were used
training data (80%) and testing data (20%) were applied. as the training set, and the test set is the DED data. During
It should be noted that when all features are used, the the training process in the XGBoost model, the grid-search
standard deviation for the XGBoost model is minimal method was used for digging hyper-parameters, including
(RMSE: 0.48 ± 0.026%). the maximum depth of each subtree and the number of
To better understand the influence of machining subtrees. The grid-search method is used to minimize the
parameters, microstructure functions, residual stress, error rate within the training set by cross-validation and
and EBSD feature inputs on model accuracy; five adjust the hyper-parameters. After the training process,
different combinations of features were designed for the test set was applied to the best XGBoost estimator
[66]
training and testing. The first combination uses only and linear model to validate the accuracy . Figure 9A
shows that the RMSE result, where all features used for the
machining parameters as the ML inputs (MP); the second XGBoost ML model, is 84.2%.
combination considers machining parameters and EBSD
features (MP + EBSD); the third combination considers The second model run in this study is that all EB-PBF,
machining parameters and residual stress (MP + XRD); the L-PBF, and DED datasets combined, where randomly
fourth design considers machining parameters and SEM selected sets of training data (80%) and test data (20%)
were applied, as shown in Figure 9B. It should be noted
A that when all features are used, the standard deviation
for the XGBoost ML model is minimal (RMSE: 0.48 ±
0.026%).
4. Discussion
In Figure 9A, there is no prediction in the linear regression
model on MP+EBSD and ALL conditions. This shows the
limitation of the classic linear regression model in that
it cannot analyze the high dimensional, low sample size
data. Predictors trained with only machining parameters
achieve an 80 – 83% accuracy for both XGBoost and linear
regression models, which demonstrates that the machining
B parameter combinations are significantly related to the
specific cutting energy. However, in the linear regression
model, when more features are added, the robust
information acts as a detriment to the model prediction.
This demonstrates that XGBoost is more favorable in
building PSP linkages among metal AM materials. This
can be observed in Figure 9A under MP + EBSD and
MP + XRD conditions, as the model prediction accuracies
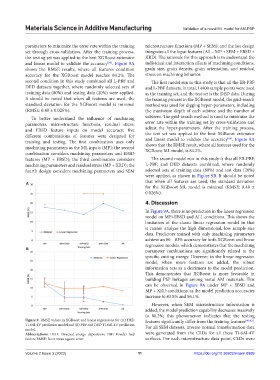
increase to 83.8% and 86.1%.
However, when SEM microstructure information is
added, the model prediction capability decreases massively
to 80.2%; this phenomenon indicates that the testing
Figure 9. RMSE values in XGBoost and linear regressions for (A) DED features significantly differ from the training features [90-92] .
Ti-6Al-4V prediction model and (B) PBF and DED Ti-6Al-4V prediction For all SEM datasets, inverse-normal transformation data
model.
Abbreviations: DED: Directed energy deposition; PBF: Powder bed were generated from the CLDs for all these Ti-6Al-4V
fusion; RMSE: Root mean square error. surfaces. For each microstructure data point, CLDs were
Volume 2 Issue 3 (2023) 11 https://doi.org/10.36922/msam.0999