
Page 129 - MSAM-2-3
P. 129
Materials Science in Additive Manufacturing Powder alteration caused by L-PBF process
D10 decrease by 3.7%, 4%, and 6.8%, respectively, while the dispenser. These results become more apparent in the
D-values of the collector powder appear to be quite similar D-values graphs, which show that the D90, D50, and D10
to the D-values of the dispenser powder before printing. values gradually decline as they move horizontally rightward
Consequently, the powder size in the dispenser during a toward the dispenser. The results are similar for the other
printing cycle remains approximately constant when a small three lines. The D50 value, for example, varies for each
part is being printed. This change can be partly attributed to horizontal line (i = 1, 2, 3, 4) by −9.8%, −10.8%, −9.6%, and
the fact that the powder is poured through a sieve with an −14.6%, respectively. However, from the top to the bottom of
80 µm mesh, so that coarse particles (>80 µm) are retained the powder bed, the vertical columns show a mild reduction
[25]
in the sieve and eliminated from the process . It should in D-values with the exception of column j = 4 (Table 3). For
also be noted that during the printing process, splashes example, the variations in D50 for vertical columns j = 1, 2,
can weld particles together. Some particle agglomerations 3, and 4 are −4.5%, +1.6%, −4.8%, and −9.5%, respectively.
do not pass through the sieve mesh, which changes the
PSD of the powder. We also collected powder samples Since the powder in the dispenser before printing
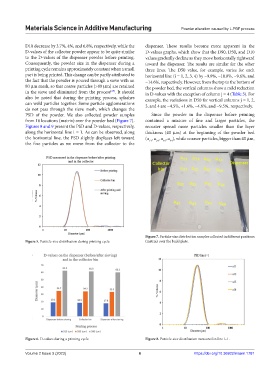
from 16 locations (matrix) over the powder bed (Figure 7). contained a mixture of fine and larger particles, the
Figures 8 and 9 present the PSD and D-values, respectively, recoater spread more particles smaller than the layer
along the horizontal line i = 1. As can be observed, along thickness (40 µm) at the beginning of the powder bed
the horizontal line, the PSD slightly displaces left toward (a , a , a , a ), while coarser particles, bigger than 40 µm,
the fine particles as we move from the collector to the 14 24 34 44
Figure 7. Particle-size distribution samples collected in different positions
Figure 5. Particle-size distribution during printing cycle. (matrix) over the build plate.
Figure 6. D-values during a printing cycle. Figure 8. Particle-size distribution measured in line i=1.
Volume 2 Issue 3 (2023) 6 https://doi.org/10.36922/msam.1781