
Page 130 - MSAM-2-3
P. 130
Materials Science in Additive Manufacturing Powder alteration caused by L-PBF process
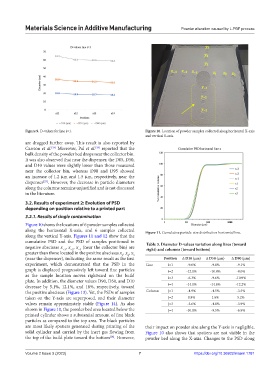
Figure 9. D-values for line i=1. Figure 10. Location of powder samples collected along horizontal X-axis
and vertical Y-axis.
are dragged further away. This result is also reported by
Carrion et al. Moreover, Pal et al. reported that the
[28]
[25]
bulk density of the powder bed drops near the collector bin.
It was also observed that near the dispenser, the D05, D50,
and D10 values were slightly lower than those measured
near the collector bin, whereas D90 and D95 showed
an increase of 1.2 µm and 1.5 µm, respectively, near the
dispenser . However, the decrease in particle diameters
[23]
along the columns remains unjustified and is not discussed
in the literature.
3.2. Results of experiment 2: Evolution of PSD
depending on position relative to a printed part
3.2.1. Results of single contamination
Figure 10 shows the locations of 6 powder samples collected
along the horizontal X-axis, and 6 samples collected Figure 11. Cumulative particle-size distribution horizontal line.
along the vertical Y-axis. Figures 11 and 12 show that the
cumulative PSD and the PSD of samples positioned in Table 3. Diameter D‑values variation along lines (toward
negative abscissas x , x , x (near the collector bin) are right) and columns (toward bottom)
−3
−2
−1
greater than those located in the positive abscissas x , x , x
3
2
1
(near the dispenser), indicating the same result as the first Position Δ D10 (µm) Δ D50 (µm) Δ D90 (µm)
experiment, which demonstrated that the PSD in the Line i=1 -9.0% -9.8% -9.1%
graph is displaced progressively left toward fine particles i=2 -12.1% -10.8% -8.0%
as the sample location moves rightward on the build i=3 -6.3% -9.6% -10.9%
plate. In addition, the diameter values D90, D50, and D10
decrease by 5.1%, 12.1%, and 18%, respectively, toward i=4 -14.1% -14.6% -12.2%
the positive abscissas (Figure 13). Yet, the PSDs of samples Column j=1 -4.9% -4.5% -3.5%
taken on the Y-axis are superposed, and their diameter j=2 0.8% 1.6% 5.2%
values remain approximately stable (Figure 14). As also j=3 -5.6% -4.8% -3.9%
shown in Figure 10, the powder bed area located below the j=4 -10.0% -9.5% -6.9%
printed cylinder shows a substantial amount of fine black
particles as compared to the top area. The black particles
are most likely spatters generated during printing of the their impact on powder size along the Y-axis is negligible.
solid cylinder and carried by the inert gas flowing from Figure 10 also shows that spatters are not visible in the
the top of the build plate toward the bottom . However, powder bed along the X-axis. Changes to the PSD along
[14]
Volume 2 Issue 3 (2023) 7 https://doi.org/10.36922/msam.1781