
Page 95 - MSAM-2-4
P. 95
Materials Science in Additive Manufacturing 3D-printed composite auxetic structures
structure has a different way of exhibiting auxetic behavior. The difference in the deformation mechanism leads
When the structures were under tension, the re-entrant to different values of Poisson’s ratio. In this study, the
struts stretched out and pushed the horizontal ribs nearby tensile tests were terminated when failure occurred. The
outward, leading to the extension of the whole structure. Poisson’s ratios under different strains were calculated
Different from the other two auxetic structures, the and summarized in Figure 8C. The rotating rigid and
rhombus structure has a positive Poisson’s ratio. When re-entrant structures have a similar Poisson’s ratio at the
the tensile loads were applied, the rhombus structure was initial stage of the tensile test. However, because of the
elongated and transversely contracted. In summary, the different deformation mechanisms, they have opposite
test specimens undergo two types of deformation, namely variation tendencies. The auxetic behavior of the rotating
tensile deformation and mechanism-type deformation. rigid structure was induced by the rotation of squares.
The latter involves rotation in the rotating rigid and angle Along with the increase of tensile strain, the rotation angles
change of struts in the re-entrant and rhombus structures. also increased, continuously enlarging the spaces between
Of note, the Poisson’s ratio of the structures exhibits a squares until the rotation angle reached 45°. The failure
broad range of variation mainly due to the mechanism- occurred before the rotation angle reached the critical
type deformation. degree. Therefore, the rotating rigid structure presented
a continuous decreasing trend of Poisson’s ratios. As for
Table 1. Mechanical properties of printing materials the re-entrant structure, the application of tensile loads on
the structure led to less obvious re-entrant characteristics
Materials Young’s modulus (MPa) Tensile strength (MPa) along the stretching. Thus, the lateral extension slowed
Smooth PA 5.82×10 3 15.2 down while the longitudinal extension remained, leading
CFC PA 1251.45±282.43 41.05±1.20 to an increasing Poisson’s ratios along with an increase in
Reinforcing fiber 135±15×10 3 2130±230 tensile strain.
The stress-strain curves of three specimens are shown in
A B Figure 8B. It can be observed that the re-entrant structure
has the maximum tensile modulus and tensile strength.
As shown in the von Mises distribution (Figure 9B), the
vertical struts are the major load-bearing components.
The stress-strain curve of the re-entrant structure can
be divided into three stages: linear elastic stage, plateau
C D
stage, and plastic stage. In the linear elastic stage, the
stress increased proportionally with the strain. Plastic
deformations or small fractures occurred at some locations,
especially the stress-concentrated areas (Figure 9B).
Such behaviors led to mechanism-type deformation,
E marked by the angle change of the re-entrant struts.
In theory, the mechanism-type deformation produces
lateral displacement output. The stress-strain curve was
said to be in the plateau stage when the stress ceased to
increase. In the plastic stage, both tensile deformation
and mechanism-type deformation happened. Both the
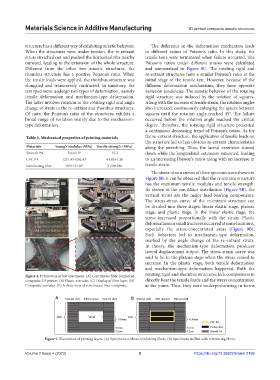
Figure 4. Fabrication of test specimens. (A) Continuous fiber-reinforced rotating rigid and rhombus structures lack components to
composite 3D printer. (B) Plastic extruder. (C) Display of fiber layer. (D) directly bear the tensile loads and the stress concentration
Composite extruder. (E) A close view of continuous fiber composite. at the joints. Thus, they were underperforming in terms
A B
Figure 5. Illustration of printing layers. (A) Specimens without reinforcing fibers. (B) Specimens infilled with reinforcing fibers.
Volume 2 Issue 4 (2023) 5 https://doi.org/10.36922/msam.2159