
Page 97 - MSAM-2-4
P. 97
Materials Science in Additive Manufacturing 3D-printed composite auxetic structures
A B
C
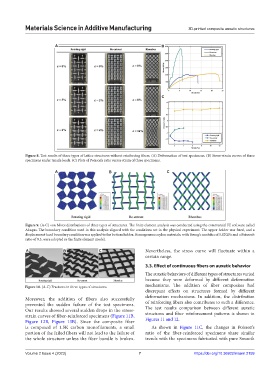
Figure 8. Test results of three types of lattice structures without reinforcing fibers. (A) Deformation of test specimens. (B) Stress-strain curves of three
specimens under tensile loads. (C) Plots of Poisson’s ratio versus strain of three specimens.
A B C
Figure 9. (A-C) von Mises distributions of three types of structures. The finite element analysis was conducted using the commercial FE software called
Abaqus. The boundary condition used in this analysis aligned with the conditions set in the physical experiment. The upper holder was fixed, and a
displacement-load boundary condition was applied to the bottom holder. Homogeneous nylon materials, with Young’s modulus of 5.82GPa and a Poisson’s
ratio of 0.3, were adopted as the finite element model.
A B C Nevertheless, the stress curve will fluctuate within a
certain range.
3.3. Effect of continuous fibers on auxetic behavior
The auxetic behaviors of different types of structures varied
because they were deformed by different deformation
Figure 10. (A-C) Fractures in three types of structures. mechanisms. The addition of fiber composites had
discrepant effects on structures formed by different
Moreover, the addition of fibers also successfully deformation mechanisms. In addition, the distribution
prevented the sudden failure of the test specimens. of reinforcing fibers also contributes to such a difference.
Our results showed several sudden drops in the stress- The test results comparison between different auxetic
strain curves of fiber-reinforced specimens (Figure 11B, structures and fiber reinforcement patterns is shown in
Figure 12B, Figure 13B). Since the composite fiber Figures 11 and 12.
is composed of 1.5K carbon monofilaments, a small As shown in Figure 11C, the changes in Poisson’s
portion of the failed fibers will not lead to the failure of ratio of the fiber-reinforced specimens share similar
the whole structure unless the fiber bundle is broken. trends with the specimens fabricated with pure Smooth
Volume 2 Issue 4 (2023) 7 https://doi.org/10.36922/msam.2159