Page 120 - MSAM-3-2
P. 120

Materials Science in Additive Manufacturing                           Hybrid lattice structures design with AI


                                                               along the X- and Y-direction were then predicted based on
                                                               the hybrid lattice design. Figure 10 depicts the correlation
                                                               between the actual properties of the hybrid lattice and the
                                                               predictions made by the BPNN model.
                                                                 Notably,  the  model  exhibited  optimal  performance
                                                               in predicting the modulus along the X-direction within
                                                               a mid-range of values, suggesting a robust capability
                                                               to capture moderate variations in material stiffness.
                                                               However, it showed tendencies to overestimate modulus
                                                               values below 12 MPa and underestimate those exceeding
                                                               20 MPa, highlighting potential limitations in accurately
                                                               predicting extreme values (Figure 10A). Similarly, for the
                                                               modulus along the Y-direction, the model demonstrated
                                                               overestimations for low values and underestimations for
                                                               high  values,  indicating a  systematic bias  in some areas
                                                               of the property space (Figure  10C). Regarding Poisson’s
                                                               ratio predictions, the model showed improved accuracy
                                                               within a mid-range of values, aligning with its proficiency
                                                               in capturing moderate variations (Figure  10B and  10C).
                                                               Nonetheless, slight underestimations and overestimations
                                                               were detected for low and high values, respectively,
                                                               suggesting regions for refinement in accurately predicting
                                                               extreme ratios.
                                                                 These findings proved the performance of the BPNN
                                                               model and provided valuable insights into its strengths
                                                               and limitations in predicting the mechanical properties
                                                               of hybrid lattice structures based on their topologies.
                                                               Further analysis and refinement of the model may enhance
                                                               its predictive capabilities and broaden its applicability in
                                                               material design and engineering.

                                                               3.4. Validation of BPNN
                                                               To  further  validate  the  capability of  the  trained  BPNN,
                                                               a dataset comprising five random hybrid lattices was
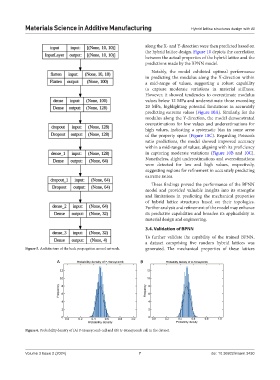
            Figure 5. Architecture of the back propagation neural network.  generated. The mechanical properties of these lattices


                         A                                   B


            Figure 6. Probability density of (A) P-Honeycomb cell and (B) G-Honeycomb cell in the dataset.


            Volume 3 Issue 2 (2024)                         7                              doi: 10.36922/msam.3430
   115   116   117   118   119   120   121   122   123   124   125