
Page 22 - MSAM-3-3
P. 22
Materials Science in Additive Manufacturing Defects in additively fabricated Al6061
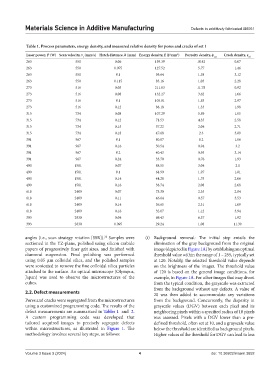
Table 1. Process parameters, energy density, and measured relative density for pores and cracks of set 1
Laser power, P (W) Scan velocity, v (mm/s) Hatch distance, h (mm) Energy density, E (J/mm ) Porosity density, ϕ Crack density, ε
3
s rel rel
263 550 0.06 159.39 10.42 0.67
263 550 0.075 127.52 5.77 1.46
263 550 0.1 95.64 1.58 3.12
263 550 0.115 83.16 1.03 2.28
273 516 0.05 211.63 11.78 0.92
273 516 0.08 132.27 3.62 1.66
273 516 0.1 105.81 1.83 2.97
273 516 0.12 88.18 1.33 1.98
315 734 0.08 107.29 5.89 1.05
315 734 0.12 71.53 4.35 2.58
315 734 0.15 57.22 2.04 2.71
315 734 0.18 47.68 2.3 3.89
391 967 0.1 80.87 8.2 1.06
391 967 0.16 50.54 0.94 3.2
391 967 0.2 40.43 0.95 3.14
391 967 0.24 33.70 0.76 1.93
490 1581 0.07 88.55 3.04 2.1
490 1581 0.1 61.99 1.97 1.81
490 1581 0.14 44.28 1.75 2.66
490 1581 0.16 38.74 2.08 2.68
618 2409 0.07 73.30 2.35 2.84
618 2409 0.11 46.64 0.57 3.53
618 2409 0.14 36.65 2.31 1.69
618 2409 0.16 32.07 1.12 3.94
393 2830 0.04 69.43 6.37 1.92
393 2830 0.095 29.24 1.08 11.39
angles (i.e., scan strategy rotation [SSR]). Samples were (i) Background removal: The initial step entails the
22
sectioned in the YZ-plane, polished using silicon carbide elimination of the gray background from the original
papers of progressively finer grit sizes, and finished with image (depicted in Figure 1A) by establishing an optimal
diamond suspension. Final polishing was performed threshold value within the range of 1 – 255, typically set
using 0.05 µm colloidal silica, and the polished samples at 120. Notably, the selected threshold value depends
were sonicated to remove the fine colloidal silica particles on the brightness of the images. The threshold value
attached to the surface. An optical microscope (Olympus, of 120 is based on the general image conditions, for
Japan) was used to observe the microstructures of the example, in Figure 1A. For other images that may divert
cubes. from the typical condition, the grayscale was extracted
from the background without any defects. A value of
2.2. Defect measurements 20 was then added to accommodate any variations
Pores and cracks were segregated from the microstructures from the background. Concurrently, the disparity in
using a customized programming code. The results of the grayscale values (DGV) between each pixel and its
defect measurements are summarized in Tables 1 and 2. neighboring pixels within a specified radius of 10 pixels
A custom programming code was developed that was assessed. Pixels with a DGV lower than a pre-
tailored acquired images to precisely segregate defects defined threshold, often set at 10, and a grayscale value
within microstructures, as illustrated in Figure 1. The below the threshold are identified as background pixels.
methodology involves several key steps, as follows: Higher values of the threshold for DGV can lead to less
Volume 3 Issue 3 (2024) 4 doi: 10.36922/msam.3652