Page 23 - MSAM-3-3
P. 23

Materials Science in Additive Manufacturing                           Defects in additively fabricated Al6061


            Table 2. Process parameters, energy density, and measured relative density for pores and cracks of set 2
            Laser power,      Scan velocity,    Hatch distance,   Energy density,    Porosity         Crack
            P (W)              v  (mm/s)          h (mm)            E (J/mm )        density,       density, ε
                                                                          3
                                s                                                                         rel
                                                                                       ϕ
                                                                                        rel
            190                  100                0.1              380.00            3.35            0.7
            200                  100                0.1              400.00            0.6             0.23
            210                  100                0.1              420.00            1.29            0.56
            220                  100                0.1              440.00            1.37            0.83
            247.5                400                0.1              123.75            3.52            1.73
            261.25               400                0.1              130.63            1.39            1.45
            275                  400                0.1              137.50            0.7             2.01
            288.75               400                0.1              144.38            0.9             1.88
            302.5                400                0.1              151.25            3.36            1.48
            450                  1496               0.1               60.16            0.64            2.59
            450                  1683               0.1               53.48            0.65            2.6
            450                  1870               0.1               48.13            0.42            2.33
            200                   85                0.1              470.59            1.7             0.33
            200                   90                0.1              444.44            1.75            0.37
            200                  100                0.1              400.00            2.8             0.66
            200                  110                0.1              363.64            2.11            0.98
            200                  120                0.1              333.33            2.73            0.94
            275                  360                0.1              152.78            3.19            1.43
            275                  380                0.1              144.74            3.61            1.65
            275                  400                0.1              137.50            0.7             2.01
            275                  420                0.1              130.95            0.98            2.68
            360                  1496               0.1               48.13            0.66            3.92
            400                  1400               0.1               57.14            0.57            2.32
            405                  1496               0.1               54.14            1.2             4.7
            405                  1870               0.1               43.32            1.13            2.78
            A                               B                                C


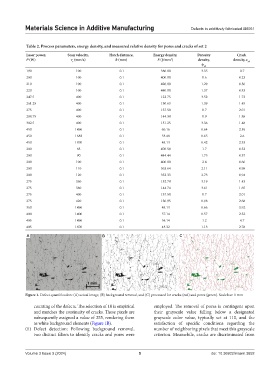
            Figure 1. Defect quantification: (A) actual image, (B) background removal, and (C) processed for cracks (red) and pores (green). Scale bar: 1 mm
               counting of the defects. The selection of 10 is empirical   employed. The removal of pores is contingent upon
               and matches the continuity of cracks. These pixels are   their grayscale value falling below a designated
               subsequently assigned a value of 255, rendering them   grayscale color value, typically set at 110, and the
               as white background elements (Figure 1B).          satisfaction of specific conditions regarding the
            (ii)  Defect detection: Following background removal,   number of neighboring pixels that meet this grayscale
               two distinct filters to identify cracks and pores were   criterion. Meanwhile, cracks are discriminated from


            Volume 3 Issue 3 (2024)                         5                              doi: 10.36922/msam.3652
   18   19   20   21   22   23   24   25   26   27   28