
Page 28 - MSAM-3-3
P. 28
Materials Science in Additive Manufacturing Defects in additively fabricated Al6061
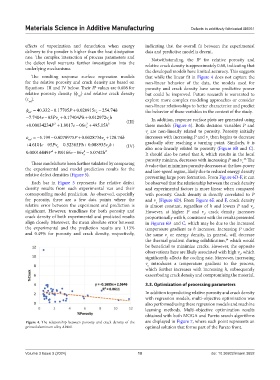
effects of vaporization and denudation when energy indicating that the overall fit between the experimental
delivery to the powder is higher than the heat dissipation data and predictive model is decent.
rate. The complex interaction of process parameters and Notwithstanding, the R for relative porosity and
2
the defect level warrants further investigation into the relative crack density is approximately 0.68, indicating that
underlying mechanisms.
the developed models have limited accuracy. This suggests
The resulting response surface regression models that while the linear fit in Figure 4 does not capture the
for the relative porosity and crack density are based on non-linear behavior of the data, the models used for
Equations III and IV below. Their R values are 0.608 for porosity and crack density have some predictive power
2
relative porosity density (ϕ ) and relative crack density but could be improved. Future research is warranted to
rel
(ε ). explore more complex modeling approaches or consider
rel
non-linear relationships to better characterize and predict
rel 40 332 0 17705. . P 0 020915 v 254 74 h the behavior of these variables in the context of the study.
.
.
s
7 7404. e 05 Pv 017. 4 404Ph 0 012972vh. s (III) In addition, response surface plots are generated using
s
0 00034234P . 2 1 8017e . 06v 495 15h 2 these models (Figure 6). Both decision variables P and
2
.
s
v are non-linearly related to porosity. Porosity initially
s
rel 5 199 0 0070975. . P 0 0028734 v 120 74 h increases with increasing P and v then begins to decrease
.
.
s
s
4 6101. e 05 Pv 0..52365Ph . 0 088935vh (IV) gradually after reaching a turning point. Similarly, h is
s
s
also non-linearly related to porosity (Figure 6B and C).
. 0 00014449P .3 0166e 06v . 5 0742h 2 It should also be noted that h, which results in the local
2
2
s
porosity minima, decreases with increasing P and v The
33
s.
These models have been further validated by comparing h value that minimizes porosity decreases at the low-power
the experimental and model prediction results for the and low-speed region, likely due to reduced energy density
relative defect densities (Figure 5). preventing large pore formation. From Figure 6D‑F, it can
Each bar in Figure 5 represents the relative defect be observed that the relationship between the crack density
density results from each experimental run and their and experimental factors is more linear when compared
corresponding model prediction. As observed, especially with porosity. Crack density is directly correlated to P
for porosity, there are a few data points where the and v (Figure 6D). From Figure 6E and F, crack density
s
relative error between the experiment and prediction is is almost constant, regardless of h and lowers P and v .
s
significant. However, trendlines for both porosity and However, at higher P and v , crack density increases
s
crack density of both experimental and predicted results proportionally with h, consistent with the results presented
align closely. Moreover, the mean absolute error between in Figures 6B and C, which may be due to the increased
the experimental and the prediction results are 1.13% temperature gradient as h increases. Increasing P under
and 0.49% for porosity and crack density, respectively, the same v or energy density, in general, will decrease
s
the thermal gradient during solidification, which would
34
be beneficial to minimize cracks. However, the opposite
observations here are likely associated with high v , which
s
significantly affects the cooling rate. Moreover, increasing
v introduces a temperature gradient to the process,
s
which further increases with increasing h, subsequently
exacerbating crack density and compromising the material.
3.3. Optimization of processing parameters
In addition to predicting relative porosity and crack density
with regression models, multi-objective optimization was
also performed using these regression models and machine
learning methods. Multi-objective optimization results
obtained with both MOGA and Pareto search algorithms
Figure 4. The relationship between porosity and crack density of the are displayed in Figure 7, where each point represents an
printed aluminum alloy Al6061 optimal solution that forms part of the Pareto front.
Volume 3 Issue 3 (2024) 10 doi: 10.36922/msam.3652