
Page 29 - MSAM-3-3
P. 29
Materials Science in Additive Manufacturing Defects in additively fabricated Al6061
Table 5. Defect density model approximations
Model Porosity density, ϕ Crack density, ε
rel rel
Estimate P SE t Estimate P SE t
β 0 40.332 0.0003 10.166 3.9672 −5.199 0.2487 4.4428 −1.1702
β −0.17705 0.0372 0.0822 −2.1537 −0.0070975 0.8444 0.035926 −0.19756
1
β 0.020915 0.0506 0.010385 2.0139 0.0028734 0.5302 0.0045385 0.63312
2
β −254.74 1.5588×10 6 45.423 −5.6082 120.74 3.3012×10 7 19.85 6.0826
3
β 12 −7.7404×10 5 0.0228 3.27×10 5 −2.3649 4.6101×10 5 0.0025 1.43×10 5 −3.2231
β 13 0.17404 0.3271 0.175 0.99182 −0.52365 2.8762×10 8 0.076683 −6.8288
β 0.012972 0.6537 0.028703 0.45193 0.088935 1.2296×10 8 0.012543 7.0902
23
β 0.00034234 0.034 0.00015611 2.193 0.00014449 0.0403 6.82×10 5 2.118
11
β 1.8017×10 6 0.1964 1.37×10 6 1.3132 3.0166×10 6 1.0132×10 5 6.00×10 7 5.0316
22
β 495.15 0.0014 144.4 3.4291 −5.0742 0.9363 63.102 −0.080412
33
Note: ϕ : RMSE=1.67, R =0.61, DOF=41; ε : RMSE=0.73, R =0.84, DOF=41.
2
2
rel
rel
Abbreviations: SE: Standard error; RMSE: Root mean square error; DOF: Degree of freedom.
Table 6. Optimum values of decision variables based on each optimization algorithm
Optimization algorithm P (W) v (mm/s) h (mm) Porosity (%) Crack (%)
s
Multi-objective genetic algorithm (MOGA) 357 568 0.21 0.43 0.45
Pareto search 355 550 0.21 0.34 0.37
A B
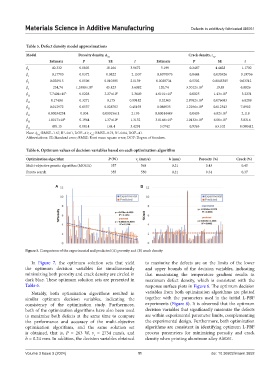
Figure 5. Comparison of the experimental and predicted (A) porosity and (B) crack density
In Figure 7, the optimum solution sets that yield to maximize the defects are on the limits of the lower
the optimum decision variables for simultaneously and upper bounds of the decision variables, indicating
minimizing both porosity and crack density are circled in that maximizing the temperature gradient results in
dark blue. These optimum solution sets are presented in maximum defect density, which is consistent with the
Table 6. response surface plots in Figure 6. The optimum decision
Notably, both optimization algorithms resulted in variables from both optimization algorithms are plotted
similar optimum decision variables, indicating the together with the parameters used in the initial L-PBF
consistency of the optimization study. Furthermore, experiments (Figure 8). It is observed that the optimum
both of the optimization algorithms have also been used decision variables that significantly minimize the defects
to maximize both defects at the same time to compare are within experimental parameter limits, complementing
the performance and accuracy of the multi-objective the experimental design. Furthermore, both optimization
optimization algorithms, and the same solution set algorithms are consistent in identifying optimum L-PBF
is obtained, that is, P = 263 W, v = 2734 mm/s, and process parameters for minimizing porosity and crack
s
h = 0.24 mm. In addition, the decision variables obtained density when printing aluminum alloy Al6061.
Volume 3 Issue 3 (2024) 11 doi: 10.36922/msam.3652