
Page 25 - MSAM-3-3
P. 25
Materials Science in Additive Manufacturing Defects in additively fabricated Al6061
at least one other objective function. The algorithm then 3. Results and discussion
forms a Pareto frontier that contains all non-dominated
solutions of the optimization problem. Many different 3.1. Microstructures and defect quantification
30
variations of the solver parameters are employed, and The results of defect quantification, the factors (P, v , and h),
s
the most suitable set is selected. The solver parameters and the corresponding levels of each experimental run are
for both MOGA and the Pareto search algorithm are presented in Tables 1 and 2 for experimental sets 1 and 2,
displayed in Tables 3 and 4. respectively. The factors and levels of each experimental
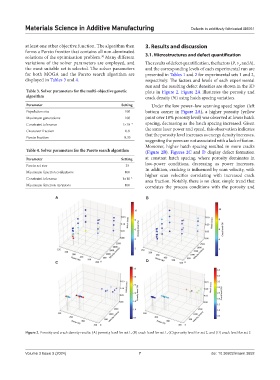
run and the resulting defect densities are shown in the 3D
Table 3. Solver parameters for the multi‑objective genetic plots in Figure 2. Figure 2A illustrates the porosity and
algorithm crack density (%) using hatch spacing variation.
Parameter Setting Under the low power–low scanning speed region (left
Population size 100 bottom corner in Figure 2A), a higher porosity (yellow
Maximum generations 100 point over 10% porosity level) was observed at lower hatch
Constraint tolerance 1×10 −3 spacing, decreasing as the hatch spacing increased. Given
Crossover fraction 0.8 the same laser power and speed, this observation indicates
Pareto fraction 0.35 that the porosity level increases as energy density increases,
suggesting the pores are not associated with a lack of fusion.
Moreover, higher hatch spacing resulted in more cracks
Table 4. Solver parameters for the Pareto search algorithm (Figure 2B). Figures 2C and D display defect formation
Parameter Setting at constant hatch spacing, where porosity dominates in
Pareto set size 35 low-power conditions, decreasing as power increases.
Maximum function evaluations 100 In addition, cracking is influenced by scan velocity, with
higher scan velocities correlating with increased crack
Constraint tolerance 1×10 −3 area fraction. Notably, there is no clear, simple trend that
Maximum function iterations 100 correlates the process conditions with the porosity and
A B
C D
Figure 2. Porosity and crack density results: (A) porosity level for set 1, (B) crack level for set 1, (C) porosity level for set 2, and (D) crack level for set 2
Volume 3 Issue 3 (2024) 7 doi: 10.36922/msam.3652