
Page 66 - MSAM-3-3
P. 66
Materials Science in Additive Manufacturing In-situ alloying of Ti41Nb by LPBF
3.4. Microstructure Highlighted in green are EDS results from targeted tests
performed on a known Nb particle to verify the equipment
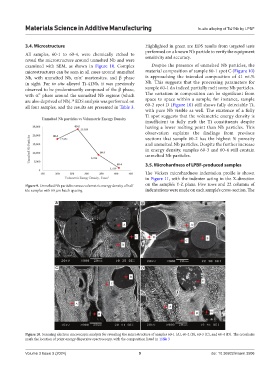
All samples, 60-1 to 60-4, were chemically etched to sensitivity and accuracy.
reveal the microstructure around unmelted Nb and were
examined with SEM, as shown in Figure 10. Complex Despite the presence of unmelted Nb particles, the
microstructures can be seen in all cases around unmelted material composition of sample 60-1 spot C (Figure 10)
Nb, with unmelted Nb, α/α’ martensites, and β phase is approaching the intended composition of 41 wt.%
in sight. For in situ alloyed Ti-41Nb, it was previously Nb. This suggests that the processing parameters for
observed to be predominantly composed of the β phase, sample 60-1 do indeed partially melt some Nb particles.
with α” phase around the unmelted Nb regions (which The variation in composition can be significant from
18
are also deprived of Nb). EDS analysis was performed on space to space within a sample; for instance, sample
all four samples, and the results are presented in Table 3. 60-2 spot D (Figure 10) still shows fully detectable Ti,
with pure Nb visible as well. The existence of a fully
Ti spot suggests that the volumetric energy density is
insufficient to fully melt the Ti constituents despite
having a lower melting point than Nb particles. This
observation explains the findings from previous
sections that sample 60-2 has the highest % porosity
and unmelted Nb particles. Despite the further increase
in energy density, samples 60-3 and 60-4 still contain
unmelted Nb particles.
3.5. Microhardness of LPBF-produced samples
The Vickers microhardness indentation profile is shown
in Figure 11, with the indenter acting in the X-direction
Figure 9. Unmelted Nb particles versus volumetric energy density of half- on the sample’s Y-Z plane. Five rows and 22 columns of
tile samples with 60 μm hatch spacing indentations were made on each sample’s cross-section. The
A B
C D
Figure 10. Scanning electron microscopic analysis for revealing the microstructure of samples 60-1 (A), 60-2 (B), 60-3 (C), and 60-4 (D). The crosshairs
mark the location of point energy dispersive spectroscopy, with the composition listed in Table 3
Volume 3 Issue 3 (2024) 9 doi: 10.36922/msam.3506