
Page 62 - MSAM-3-3
P. 62
Materials Science in Additive Manufacturing In-situ alloying of Ti41Nb by LPBF
features. Coupled with the image stitching function of the excessive balling, damaging the recoater and resulting in
VK-X200 confocal microscope, the entire sample surface poor powder recoating, subsequently leading to defective
could be mapped. parts. This phenomenon, known as humping, is caused
37
Scanning electron microscopy (SEM) with energy by the elongated melt pool leading to Rayleigh instability.
dispersive spectroscopy (EDS) detector by Oxford It can result in inconsistencies in powder bed depth and,
Instruments (aided by INCA software; UK) was also consequently, unstable builds. Similarly, excessive balling
utilized to reveal the composition and microstructure was observed in samples with 40 μm hatch spacing. A set
around the unmelted niobium particles. Selected points of samples processed with a hatch spacing of 80 and 60 μm
of the samples were identified for elemental composition was analyzed, with those with hatch spacing of 60 μm
analysis through EDS. being selected as they presented no visible surface warping
in the as-built condition. One-half of each sample tile was
For mechanical testing, the Future-Tech FM-300e cut from the LPBF base plate, as shown in Figure 4. The
Vickers Microhardness tester (Japan) was employed for rest of the samples, while possessing interesting aspects,
Vickers hardness tests, which featured a diamond square- were not studied, as the focus of the paper does not lie in
based pyramid indenter with an apex angle of 136°. obtaining the best parameters, but rather in studying the
The indenter was depressed onto the specimen with a effect of thermal rest time. Therefore, the selection process
steady load of 1 kgf, ensuring the spacing between each was primarily narrowed down through visual inspection
indentation and the edges of the specimen exceeded three and is not crucial for the broader findings.
times the diagonal length of indentation.
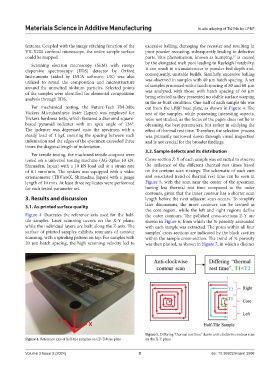
3.2. Sample defects and its distribution
For tensile testing, the machined tensile coupons were
tested on a universal testing machine (AG-Xplus 10 kN, Cross-section Z-Y of each sample was extracted to observe
Shimadzu, Japan) with a 10 kN load cell at a strain rate the influence of the different thermal rest times based
of 0.1 mm/min. The system was equipped with a video on the contour scan strategy. The schematic of such cuts
extensometer (TRViewX, Shimadzu, Japan) with a gauge and associated trend of thermal rest time can be seen in
length of 10 mm. At least three replicates were performed Figure 5, with the scan near the center of the specimen
for each tested parameter set. having less thermal rest time compared to the outer
contours, given that the inner contour has a shorter scan
3. Results and discussion length before the next adjacent scan occurs. To simplify
3.1. As-printed surface quality later discussions, the inner contours can be termed as
the core region, while the left and right regions define
Figure 4 illustrates the reference axis used for the half- the outer contours. The polished cross-sections Z-Y are
tile samples. Laser scanning occurs on the X-Y plane, shown in Figure 6, from which the % porosity associated
while the individual layers are built along the Z-axis. The with each sample was extracted. The pores within all four
surface of printed samples exhibits remnants of contour samples’ cross-sections are indicated by the black cavities
scanning, with a spiraling pattern on top. For samples with within the sample cross-section. The trend of % porosity
20 μm hatch spacing, the high scanning velocity led to was then plotted, as shown in Figure 7, in which a distinct
Figure 5. Differing “thermal rest time” due to anti-clockwise contour scan
Figure 4. Reference axis of half-tile samples on CP-Ti base plate on the X-Y plane
Volume 3 Issue 3 (2024) 5 doi: 10.36922/msam.3506