
Page 64 - MSAM-3-3
P. 64
Materials Science in Additive Manufacturing In-situ alloying of Ti41Nb by LPBF
scan, which results in the core region being exposed to the energy density of 340 J/mm³ and 410 J/mm³, exhibit
laser source at shorter intervals (Figure 5). The core region the characteristic of a lack-of-fusion defect and keyhole
is composed of shorter scanning vectors, which is opposed porosity. This is surprising, given that the volumetric energy
to the one on the outer contour, and with short scanning density is relatively high, with previous literature showing
vectors, constant scanning velocity meant that the adjacent near full density obtainable with similar energy density,
laser scan will occur in a lesser time near the core region which would have formed mainly keyhole porosity. The
as opposed to the outer region, hence leading to more usage of high energy density leads to excessive vaporization
thermal accumulation, given that there are less time for the and high vapor pressure, pushing the melt and create deep
heat to dissipate before subsequent scan. Thus, with less drill in the melt pool. This deep cavity allows for increased
“thermal rest time,” the core region exhibits better titanium laser absorption and exacerbates the drilling effect. When
melting characteristics and fewer porosities. the melt pool collapses, some gas is trapped before it can
In sample 60-2, large porosities are found in the escape, thereby leading to keyhole pores. This suggests that
left and core regions of the cross-section, while small there are additional melt pool dynamics that need to be
porosities are found in the right region, indicating that considered when contour scan is used, and these dynamics
built instability could occur despite theoretically similar have not yet been studied.
scanning strategies. The layer-like porosities form in 3.3. Distribution of unmelted niobium particles
the same manner as explained previously, constituting
a lack-of-fusion defect. However, one can still observe Sample imaging and computerized particle tabulations
that the pores in the core region are smaller and less are performed on the polished Y-Z plane of the half-tile
continuous compared to the left region, owing to thermal samples. After image processing, unmelted Nb particles
accumulation promoting melting with lesser thermal rest (in white) were clearly visible across the samples’ cross-
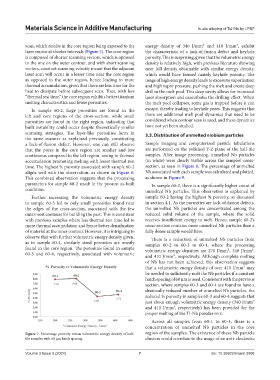
time. The highest % porosity associated with sample 60-2 section, as seen in Figure 8. The percentage of unmelted
aligns well with the observation, as shown in Figure 6. Nb associated with each sample was calculated and plotted,
This combined observation suggests that the processing as shown in Figure 9.
parameters for sample 60-2 result in the poorest as-built In sample 60-2, there is a significantly higher count of
condition. unmelted Nb particles. This observation is explained by
Further increasing the volumetric energy density sample 60-2 having the highest % porosity, as discussed
to sample 60-3 led to only small porosities found near in section 4.1. As the porosities are lack-of-fusion defects,
the edges of the cross-section, associated with the few the unmelted Nb particles are concentrated among the
outermost contours for building the part. This is consistent reduced solid volume of the sample, where the solid
with previous samples where less thermal rest time led to receives insufficient energy to melt. Hence, sample 60-2’s
more thermal accumulation and hence better densification cross-section contains more unmelted Nb particles than a
of material at the inner contour. However, it is intriguing to fully dense sample would have.
observe that with further volumetric energy density given, There is a reduction of unmelted Nb particles from
as in sample 60-4, similarly sized porosities are mostly samples 60-2 to 60-3 to 60-4, where the processing
found in the core region. The porosities found in sample volumetric energy densities are 270 J/mm³, 340 J/mm³,
60-3 and 60-4, respectively, associated with volumetric and 410 J/mm³, respectively. Although complete melting
of Nb has not been achieved, this observation suggests
that a volumetric energy density of over 410 J/mm³ may
be needed to sufficiently melt the Nb particles if a constant
hatch spacing of 60 μm is used. Consistent with the previous
section, where samples 60-3 and 60-4 are found to have a
drastically reduced number of unmelted Nb particles, the
reduced % porosity in samples 60-3 and 60-4 suggests that
just about enough volumetric energy density (340 J/mm³
and 410 J/mm³, respectively) has been provided for the
proper melting of the Ti-Nb powder mix.
Across all samples from 60-1 to 60-4, there is a
concentration of unmelted Nb particles in the core
Figure 7. Percentage porosity versus volumetric energy density of half- region of the samples. The existence of these Nb particle
tile samples with 60 μm hatch spacing clusters could correlate to the usage of an anti-clockwise
Volume 3 Issue 3 (2024) 7 doi: 10.36922/msam.3506