
Page 35 - MSAM-4-2
P. 35
Materials Science in Additive Manufacturing Measuring the porosity of AM components
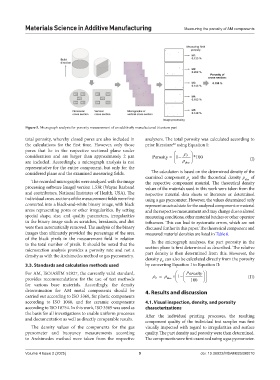
Figure 5. Micrograph analysis for porosity measurement of an additively manufactured titanium part
total porosity, whereby closed pores are also included in analyzers. The total porosity was calculated according to
the calculations for the first time. However, only those prior literature using Equation I:
22
pores that lie in the respective sectional plane under
consideration and are larger than approximately 2 μm Porosity 1 = − ρ P *100 (I)
are included. Accordingly, a micrograph analysis is not ρ theo
representative for the entire component, but only for the
considered plane and the examined measuring fields. The calculation is based on the determined density of the
examined component ρ and the theoretical density ρ of
theo
p
The recorded micrographs were analyzed with the image the respective component material. The theoretical density
processing software ImageJ version 1.53k (Wayne Rasband values of the materials used in this work were taken from the
and contributors, National Institutes of Health, USA). The respective material data sheets or literature or determined
individual cross-sections of the measurement fields were first using a gas pycnometer. However, the values determined only
converted into a black-and-white binary image, with black represent an actual state for the analyzed component or material
areas representing pores or other irregularities. By setting and the respective measurement and may change due to altered
special shape, size, and quality parameters, irregularities measuring conditions, other material batches or other operator
in the binary image such as scratches, breakouts, and dirt influences. This can lead to systematic errors, which are not
were then automatically removed. The analysis of the binary discussed further in this paper. The theoretical component and
images then ultimately provided the percentage of the area measured material densities are listed in Table 6.
of the black pixels in the measurement field in relation
In the micrograph analyses, the part porosity in the
to the total number of pixels. It should be noted that the section plane is first determined as described. The relative
microsection analysis provides a porosity rate and not a part density is then determined from this. However, the
density as with the Archimedes method or gas pycnometry.
density ρ can also be calculated directly from the porosity
P
3.3. Standards and calculation methods used by converting Equation I to Equation II:
For AM, ISO/ASTM 52927, the currently valid standard, Porosity
provides recommendations for the use of test methods ρ P ρ = × 1 − theo 100 (II)
for various base materials. Accordingly, the density
determination for AM metal components should be 4. Results and discussion
carried out according to ISO 3369, for plastic components
according to ISO 1068, and for ceramic components 4.1. Visual inspection, density, and porosity
according to ISO 18754. In this work, ISO 3369 was used as characterizations
the basis for all investigations to enable uniform processes After the individual printing processes, the resulting
and documentation as well as directly comparable results.
component quality of the individual test samples was first
The density values of the components for the gas visually inspected with regard to irregularities and surface
pycnometer and buoyancy measurements according quality. The part density and porosity were then determined.
to Archimedes method were taken from the respective The components were first examined using a gas pycnometer.
Volume 4 Issue 2 (2025) 9 doi: 10.36922/MSAM025090010